
Fig. 4. NKT cell cytokine response to AGLs.
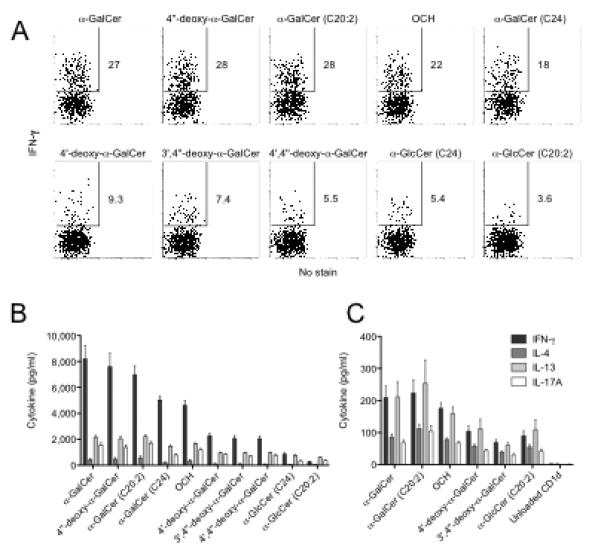
For (A) and (B), thymocytes enriched for NKT cells were cultured for 8h with Tcra-Jtm1Tg (Jα18−/−) splenocytes previously pulsed with glycolipid (100ng/ml). GolgiStop (BD Biosciences) was added for the last 4h (A) The percentage IFN-γ+ α-GalCer-CD1d tetramer+ NKT cells was detected by ICS. Data is representative of 4 similar experiments. (B) Culture supernatants were collected at 8h and cytokine amounts were quantified using CBA (BD Biosciences). Data is taken from one of at least 3 representative experiments, (n=5 replicates), graphs depict mean and SEM. (C) Supernatants from cells stimulated by plate bound CD1d-glycolipid complex, as described in Fig. 3C, were harvested at 72hr and cytokines analysed by CBA. Graphs depict the concentration of cytokines ± SEM of n=3 replicates per group from a single expt.