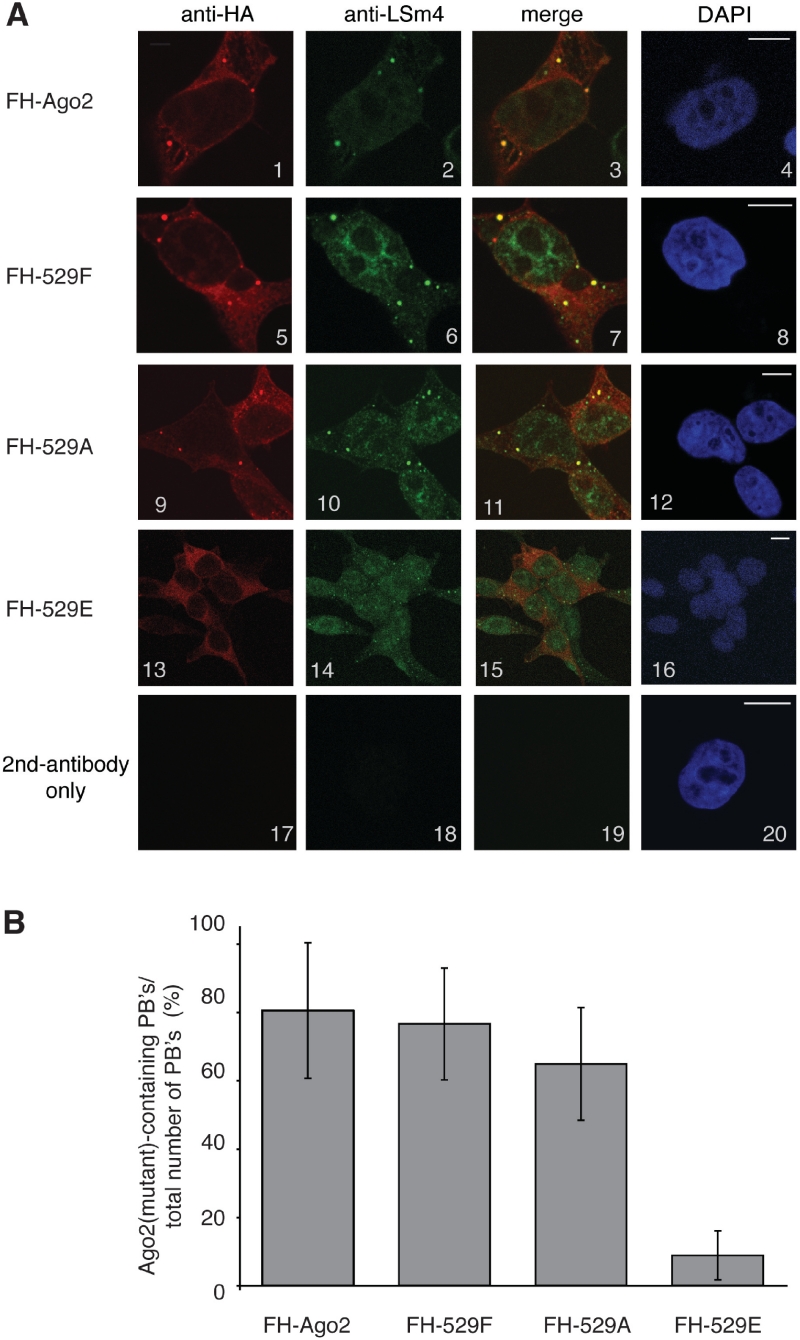
Figure 3.
Cellular localization of Ago2 Y529 mutants. (A) FH-Ago2 (panels 1–4), FH-Ago2 Y529F (panels 5–8), FH-Ago2 Y529A (panels 9–12), FH-Ago2 Y529E (panels 13–16) were transfected into HEK 293 cells. Cells were stained with anti-HA antibodies (panels 1, 5, 9, 13) and antibodies against LSm4 (panels 2, 6, 10, 14). In panels 17–20, only the secondary antibody was used. Bars represent 10 µm. (B) Quantification of Ago2- or Ago2 Y529 mutant-positive P-bodies relative to the total number of counted P-bodies.

