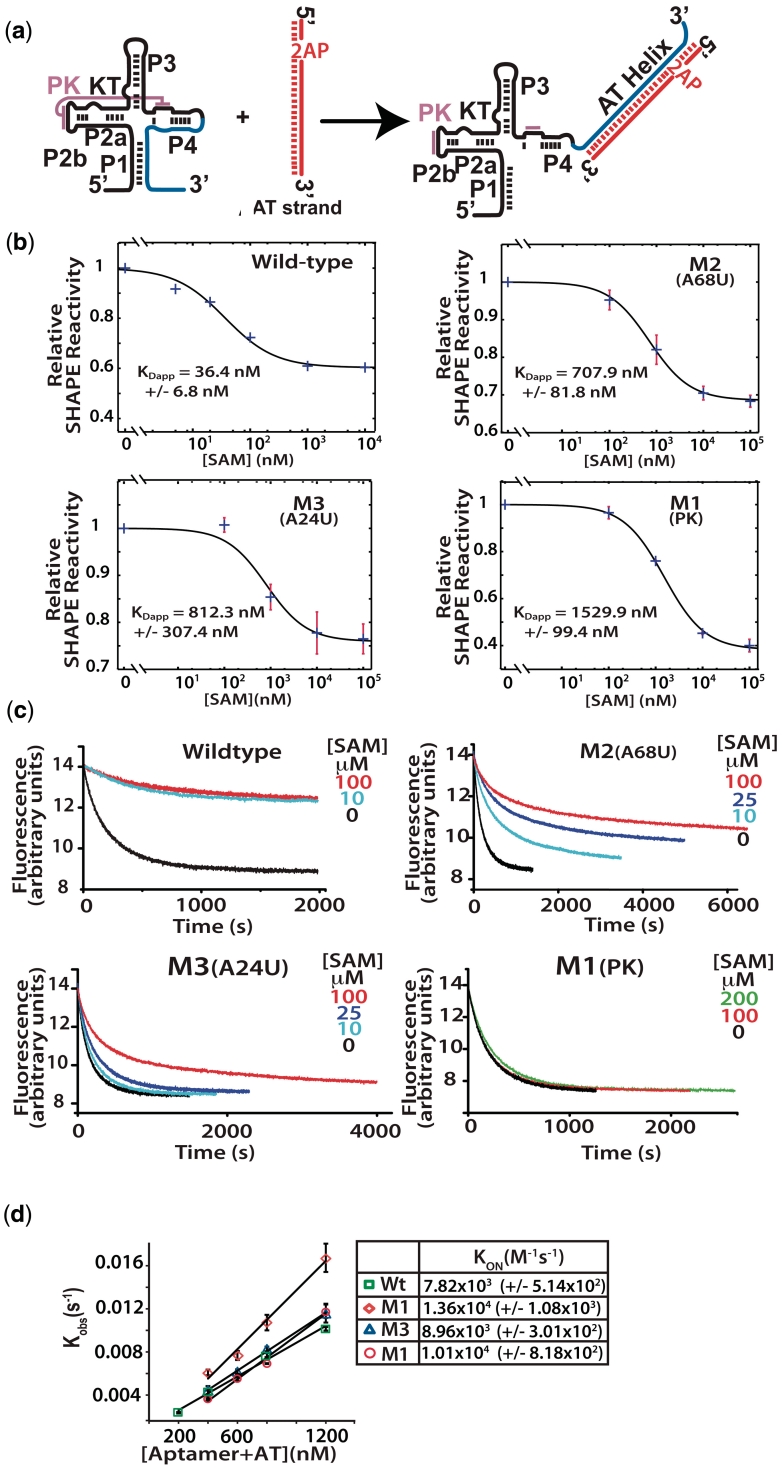
Figure 3.
(a) Analytical switching construct. 2-Aminopurine incorporated AT strand associates with the aptamer domain forming the AT helix. (b) Fluorescence trace following the quenching of 2-AP by interaction with the wild-type aptamer and mutant aptamers. Association was followed with various concentrations of SAM as indicated. Samples were rapidly mixed at 25°C and 1:1 ratio of aptamer to AT to a final aptamer concentration of 300 nM, excitation was at 310 nm (5 nm slit width) and fluorescence detected at 372 with a 10-nm slit width. (c) Apparent dissociation constants (KDapp) were determined for the wild-type and mutant constructs. SHAPE probing reactions were performed on samples equilibrated in the presence of varying concentrations of SAM. The decreases in reactivity of a selected nucleotide relative to its reactivity in the absence of SAM were plotted versus SAM concentration and fit to a two state binding model (see ‘Materials and Methods’ section). Standard asymptotic errors for the fit are shown. Error bars represent the standard deviation of a minimum of three replica experiments. (d) Initial rates were fit to a single exponential and the observed rate constants plotted as a function of RNA concentration ([aptamer] + [AT strand]) and the second order rate constants (kon) were determined for each construct.

