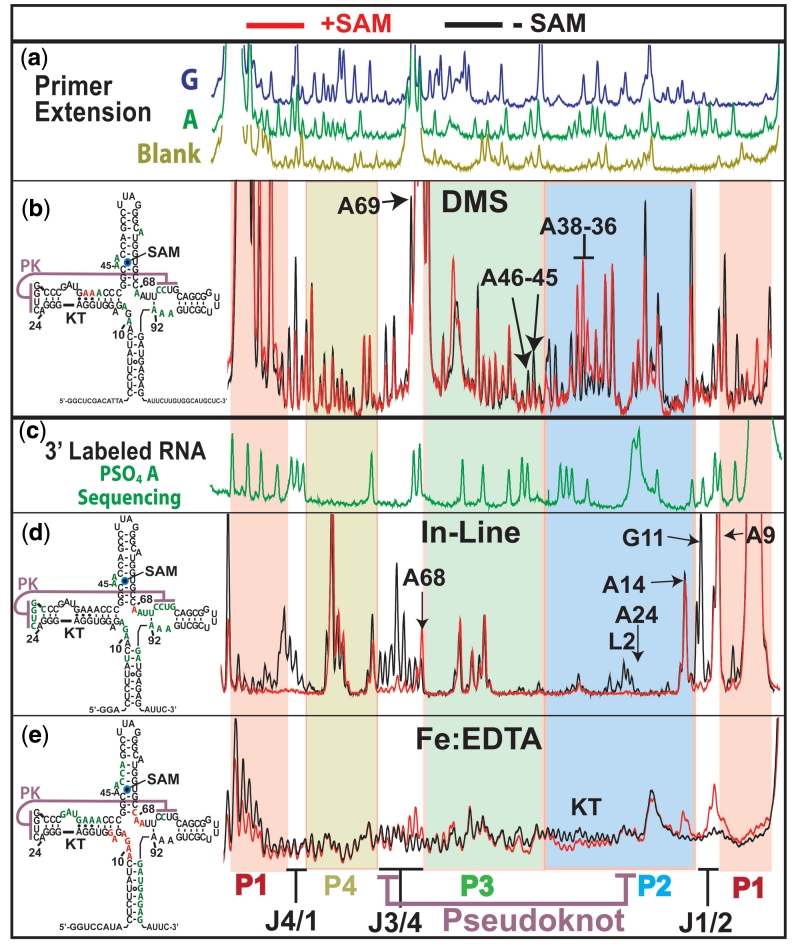
Figure 4.
Structural probing results for the wild-type aptamer domain. Red capillary electrophoresis traces are probing results in the presence of 10 µM SAM, black are without. Left, 2D structures summarize SAM dependent sites of decreased (green) and increased (red) reactivity. (a) Primer extension dideoxy sequencing reactions, for guanosine (green) and adenosine (blue) and primer extension control in brown. (b) DMS probing results. Capillary electrophoresis traces of primer extension reactions using 5′ fluorescently labelled primers. (c) Green trace shows iodine cleavage pattern of α-phosphorothioate adenosine incorporated RNA. RNA was 3′-labelled with a 3′ fluorescently labelled DNA oligo. (d) In-line probing results using 3′ fluorescently labelled RNA. (e) Fe:EDTA generated hydroxyl radical cleavage pattern from 3′ fluorescently labelled RNA. Bottom, coloured underlay coded for helices and indicating joining regions and pseudoknot interaction and KT.

