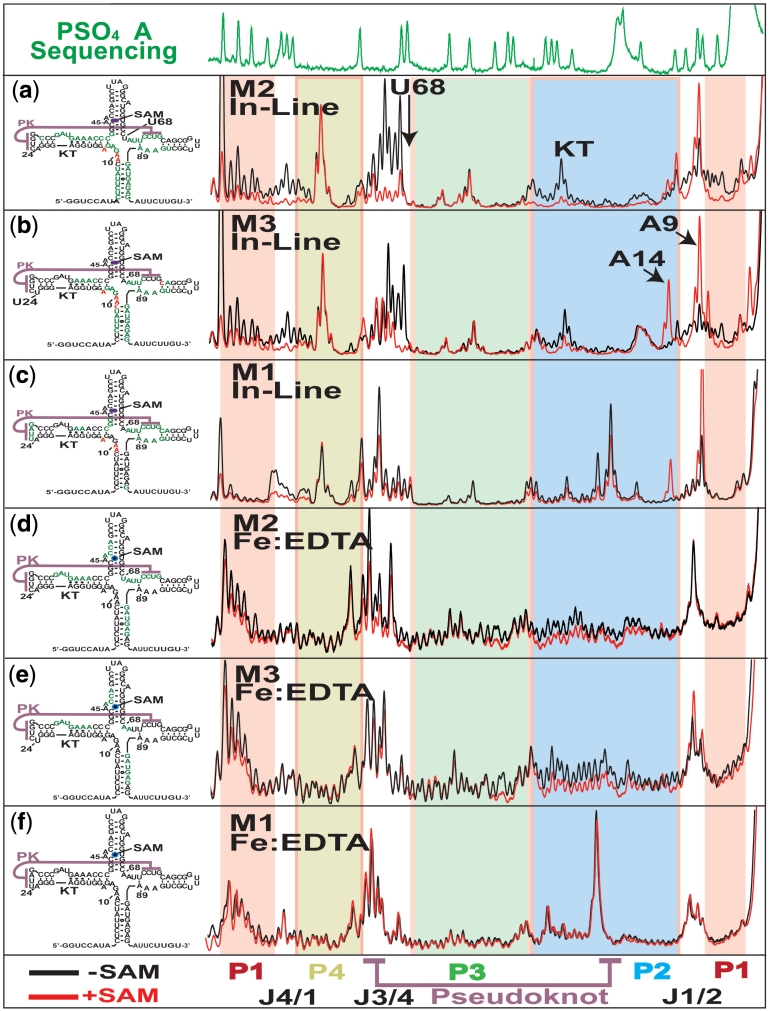
Figure 5.
Capillary electrophoresis analysis of structure probing experiments using 3′ fluorescently labelled mutant aptamers. Top, α-phosphorothioate adenosine sequencing same as Figure 4. (a–c) Left, Fluorescence electropherograms for in-line probing of M2, M3 and M1 pseudoknot mutants showing protections patterns with (red) and without (black) 10 µM SAM. Right, secondary structure representation summarizing the probing results for each experiment indicating increasing (red) and decreasing (green) reactivity in response to ligand. (d and e) Traces for Fe:EDTA catalysed hydroxyl radical probing experiments displayed same as above.

