Figure 6.
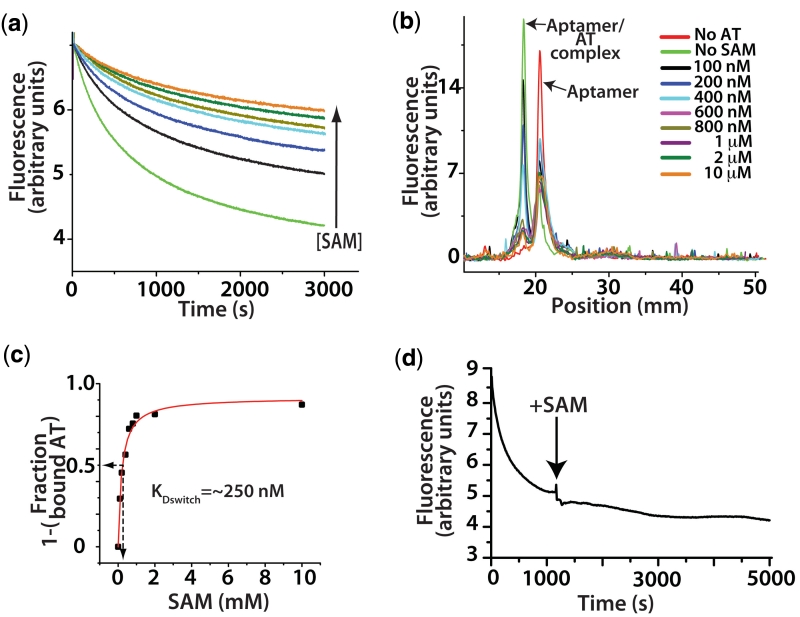
The effect of ligand interactions on switching. (a) A titration of SAM in the fluorescence based switching assay at a concentration of 100 nM of both aptamer and AT. Concentrations of SAM follow the legend in (b) with the exception of brown which is 500 nM. (b) Overlay of fluorescence based lane traces from native polyacrylamide gel electrophoresis analysis of equilibrium switching study. (c) Traces from (b) were integrated and the fraction of aptamer associated AT relative to the sample with no SAM was calculated and plotted versus SAM concentration and rectangular hyperbola fit. Arrows indicate the concentration at which 50% of the aptamer was associated, ∼250 nM. (d) Trace showing that the full formation of the AT helix is essentially irreversible by SAM interactions alone. Switching assay performed with the aptamer domain (5 nM) labelled on the 5′ with Cy-5 and the 3′-terminus with Cy-3. In the aptamer conformation the fluorescent dyes FRET strongly (excitation 535 nm, emission 670 nM). As the unlabelled AT (1 µM) associates the dyes are separated and go to a low FRET state. After the association reaction was allowed to proceed to ∼80% completion, SAM was added to a concentration of 1 mM (indicated by arrow). The failure to recover any FRET intensity indicates the aptamer is not reforming at the expense of the AT helix.

