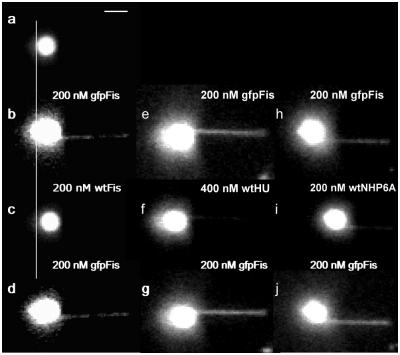
Figure 2.
Sequences of Fis exchange images. DNA is tethered to a glass surface on the right with the magnetic bead on the left and an applied force of 0.7 pN. (a) Image of bead tethered by a single λ-DNA molecule prior to addition of Fis. (b) Image of complex formed on DNA by addition of 200 nM gfpFis, obtained after washing with 1 ml of buffer. (c) Same tether as in (b) after introducing 200 nM wtFis. Exchange occurs on the time-scale required to flow the new solution into the cell (∼30 s). Vertical line highlights the length difference (a two-pixel shift to the right) indicating Fis is bound. (d) Reintroduction of gfpFis replaces wtFis. Image was obtained after buffer wash as above. (e–g) Separate experiment showing exchange between gfpFis and wtHU. (h–j) Similar experiment showing exchange between gfpFis and wtNHP6A. Note the incomplete exchange evident in panels (f and i), both along the tether and the DNA coils bound to the bead, which is likely due in part to differing affinities of the solution phase and bound proteins, as discussed in the text. Scale bar (top) is ∼3 μm.

