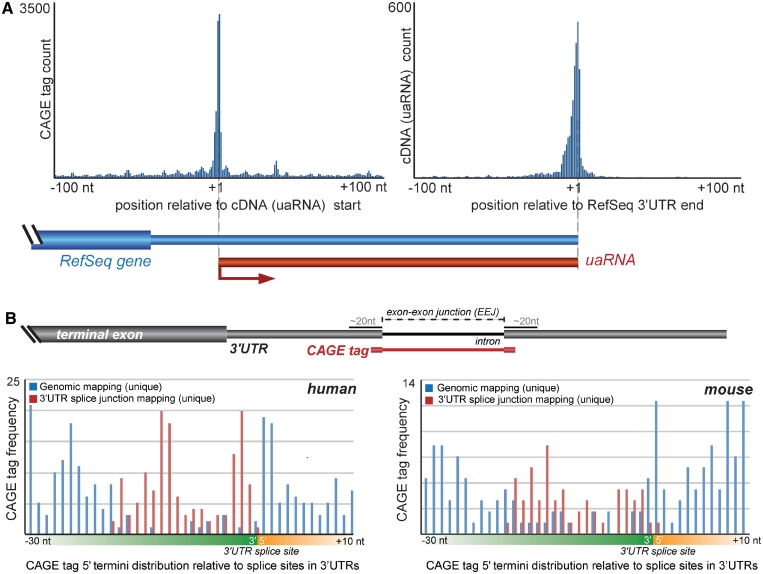
Figure 1.
Post-transcriptional processing of 3′UTRs. (A) Full-length cDNA transcripts associated with 3′UTRs. Histogram (left) shows enrichment of CAGE tags with the 5′ termini of cDNAs mapping within 3′UTRs (i.e. uaRNAs). Histogram (right) shows correlated enrichment of the terminal regions of these cDNA transcripts with the 3′ end of the host RefSeq gene. (B) The top panel shows a schematic representation of the mapping strategy employed to discern CAGE tags that span exon–exon junctions (EEJs) and therefore suggest post-transcriptional processing. The lower panels show the distribution of CAGE tags mapping proximal to EEJs in human (left) and mouse (right). The frequencies of CAGE tags that map uniquely to the genome (blue) are under-represented adjacent to EEJs. This under-representation is reconciled by considering CAGE tags that map across EEJs (red).

