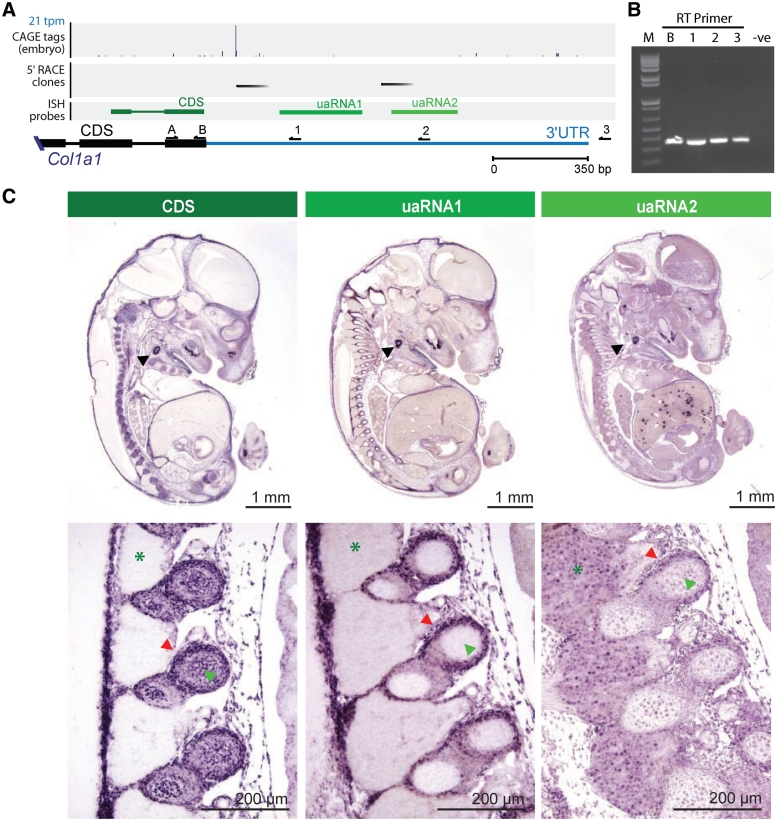
Figure 4.
uaRNAs within Col1a1 3′UTR. (A) Genome browser view of Col1a1 3′UTR showing; histogram of CAGE distribution and density (top panel; tpm, tags per million), 5′ ends inferred from high confidence 5′ RACE products (second panel, black bars); riboprobes used in in situ hybridization (third panel; green bars); Col1a1 annotated coding sequence (CDS; black bar) and 3′UTR (blue bar); reverse transcriptase (RT, 1–3) and PCR primers (A and B) used in (B) (black arrows). (B) Confirmation of 3′UTR annotation by RT using primers B, 1, 2 or 3 followed by PCR using primers A (forward) and B (reverse). Lanes contain (from left to right) 1-kb plus ladder (M), positive CDS control primer (B), RT primers (1–3) and no RT negative control (-ve). (C) ISH using one riboprobe in the terminal constitutive coding exon (CDS, dark green) of the Col1a1 gene and two probes (uaRNA1 and uaRNA2, light green) corresponding to 3′UTR sequences, one downstream of each of the two 5′ RACE clusters. All three probes exhibit expression at sites of chondrogenesis, such as the otic vesicle (upper panel, black arrowheads) and the developing ribs (lower panel, red arrowheads). Expression of the coding region is apparent during ossification of vertebrae, in contrast to both uaRNAs whose expression is absent (lower panel, green arrowheads). The uaRNA2 probe detects expression in the the dorsal root ganglia (lower panel, green asterisks); this expression is not detected by the CDS or uaRNA1 probes. Higher magnification of the dorsal root ganglia shows that the uaRNA expression is localized to the nucleus (lower panel, green asterisk).

