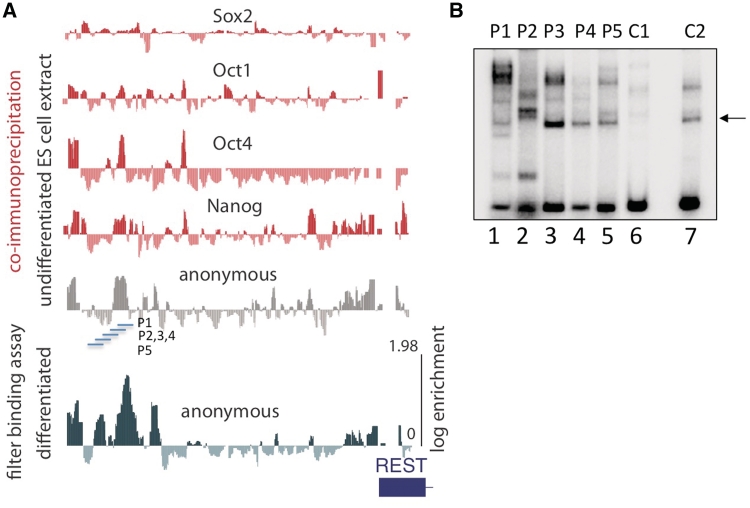
Figure 2.
A map of cis-element in the upstream control region of the REST gene. (A) UCSC genome browser view of the REST gene displays the results of the binding assay on four specific TFBSs (Oct1, Oct4, Sox2 and Nanog) and the anonymous complexes. Oligonucleotide enrichments in the filter binding assays performed after incubation in undifferentiated ES cell extract (horizontal gray wiggle plot) and differentiated extract (horizontal green wiggle plot) are aligned for comparison. The location of gel shift probes (P1, P2, P3, P4 and P5) is indicated. (B) Gel shift assay validates array. Radiolabelled probes P1–5 and control probes C1 and C2 were incubated with extract and analyzed by EMSA. Apparent examples of non-specific binding (i.e. bands seen across multiple experimental and control lanes) are indicated with an arrow.

