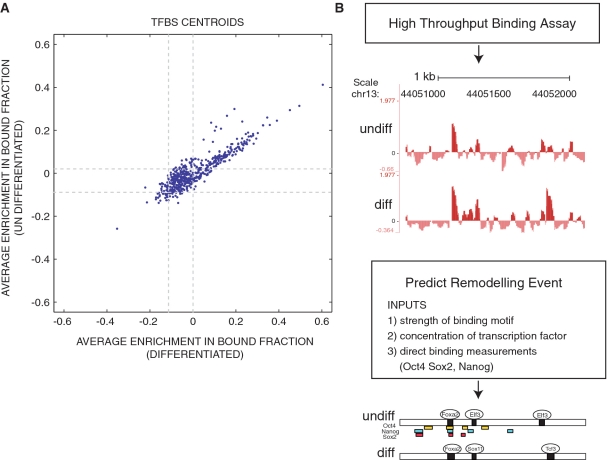
Figure 4.
The computational reconstruction of remodeling events that occur during ES cell differentiation. Transcription factor binding models were downloaded from UNIPROBE and JASPAR and used to score the oligonucleotide pool. (A) For each transcription factor, TFBS centroids were constructed by averaging the binding enrichment scores of oligonucleotides that contained the top 100 matches to the transcription factor binding model. Centroid enrichment in the bound fraction of differentiated and undifferentiated extract were plotted over 95% confidence intervals (dashed gray line). (B) Remodeling events were inferred from measurements of protein/DNA complex formation performed with 33663 genomic oligonucleotide sequences and nuclear extract from undifferentiated and differentiated ES cells. The example of binding enrichments projected onto genomic coordinates is shown for the TSC22 d1 gene. The y-axis represents array enrichment the x-axis represents genomic position. Regions enriched above the 5% threshold were called ‘bound’ and annotated with binding events predicted to occur in the differentiated and undifferentiated state (see ‘Methods’ section). This prediction was graphically displayed below. Oligonucleotides enriched in the top 5% of the immunoprecipitate of Oct4 (yellow), Nanog (blue) or Sox2 (red).

