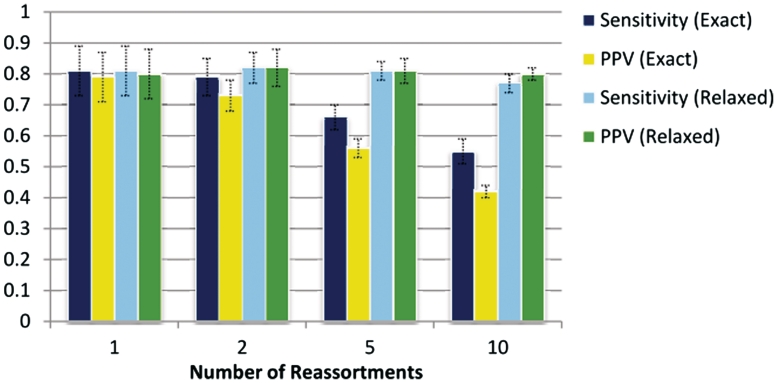
Figure 6.
Robustness to complex reassortment histories. The graph summarizes results from four datsets where minsize = 1, maxsize = 20 and count was varied over the set {1, 2, 5, 10}, testing GiRaF’s robustness to multiple reassortments and complex histories. While the task of identifying the original implants (‘Exact’ results) becomes increasingly intractable, GiRaF’s sensitivity and PPV remain stable under a more relaxed definition of matches (‘Relaxed’ results).

