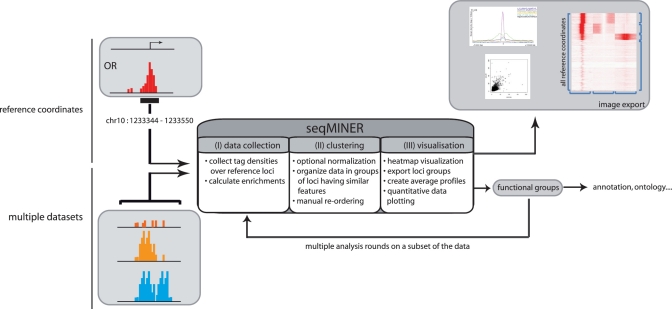
Figure 1.
Schematic representation of the general workflow of seqMINER. seqMINER takes as an input a single set of reference loci (i.e. gene promoters or binding sites) and multiple raw sequencing datasets. seqMINER can collect tag densities or calculate enrichment values around the set of reference coordinates. Using a combination of automated clustering and manual reordering methods, seqMINER helps the user to create functional groups within the reference set. Each specific sub-group in the dataset can be visualized as heatmaps, dotplots or average plots and the groups of loci can be exported for further analysis.

