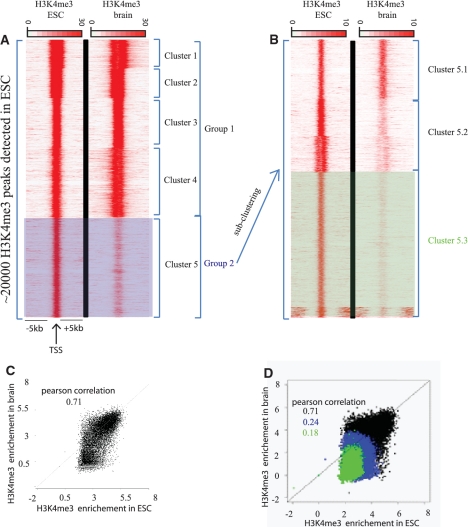
Figure 5.
Quantitative changes of H3K4me3 mark in mouse brain cells relative to mESCs. Tag densities of regions surrounding the H3K4me3 enriched loci in ESCs. Publicly available ChIP-seq datasets for H3K4me3 in ESCs and in brain cells were used in this comparative analysis. (A) H3K4me3 enriched loci in ESC were detected using MACS software, these loci were used as reference coordinates. Tag densities from H3K4me3-ESC and H3K4me3-brain datasets were collected within a window of 10 kb around the reference coordinates, and then the density files were subjected to k-means clustering. Two major groups can be isolated: group1 contains loci with significant and equal enrichment of H3K4me3 in both ESC and brain; group 2 contains loci with higher enrichment of H3K4me3 in ESC relative to brain tissue. (B) As a second step of analysis, the loci in group 2 were used as reference. The densities around these loci were recollected and a second round of clustering was performed. After the second round of clustering, three clusters can be isolated: cluster 5.1, 5.2 and 5.3 corresponding to loci weakly, moderately and strongly enriched in H3K4me3 mark in ESC relative to brain, respectively. Note that the bottom of the cluster 5.3 that has H3K4me3 enrichment distant from the cluster center was not considered as a separate entity since we focused our analysis on the differential signal in the cluster center. (C) Quantification of the changes observed between the two conditions. Dot-plot representing H3K4me3 enrichments in ESC versus brain. Enrichments were calculated for H3K4me3-ESC and H3K4me3-brain datasets within a window of 2 kb around the complete set of reference coordinates (black dots), (D) and against previously isolated subsets of the reference coordinates (group2 in blue and subset 5.3 in green).

