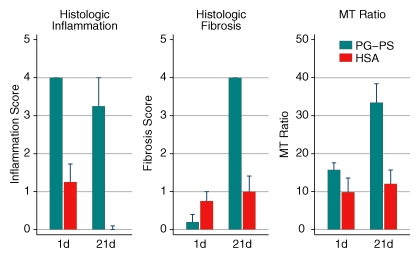
Figure 7:
Bar charts show the changes in histologic inflammation, histologic fibrosis, and MT ratio from 1 day (early inflammatory phase) to 21 days (late fibrotic phase) after laparotomy. Note that the MT ratio of rats injected with PG-PS increased from day 1 to day 21, in parallel with the increase in fibrosis and opposite to the change in inflammation, which decreased somewhat. Control animals demonstrated no increase in MT ratio or fibrosis, and inflammation resolved completely.

