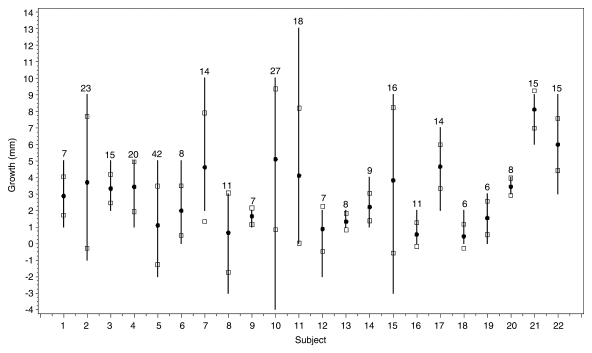
Figure 2:
Reader estimates for the 22 nodules judged to have grown by most readers. Each vertical line gives the range of reader estimates for growth (longest diameter). Circles are mean estimates; squares are mean estimates ± 1 standard deviation. Numbers above the line are mean estimated nodule sizes (in millimeters) at follow-up.

