
Table 2.
Number of Nodules Showing Changes in Growth, Attenuation, and/or Margins and Percentage of Positive Screening Results according to Reader
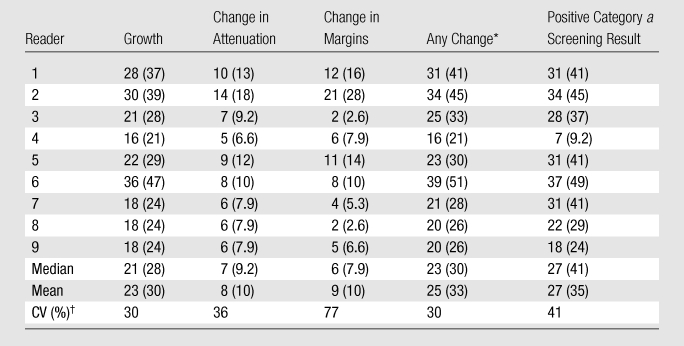
Note.—Except where indicated, data are numbers of nodules; numbers in parentheses are percentages. Data were obtained in the 76 nodules that were determined by all readers to be present at baseline.
*
Nodules with growth, change in attenuation, or change in margins.
†
CV = coefficient of variation (standard deviation/mean).