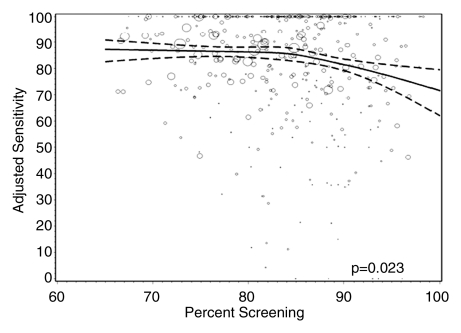
Figure 1d:
Graphs show adjusted sensitivity according to interpretive volume, in terms of (a) total volume, (b) screening volume, (c) diagnostic volume, and (d) percentage of total mammograms that represented screening examinations. Sensitivity was adjusted for age and time since last mammogram. Lines = regression spline fit to adjusted rates; dashed lines = 95% CIs; and ○ = adjusted sensitivity, with size proportional to the number of total cancers. Smoothing splines had three knots placed at the 33rd, 50th, and 67th percentiles of the volume distribution; estimations were limited to total volume of 6000 or fewer mammograms, screening volume of 5000 or fewer mammograms, diagnostic volume of 2000 or fewer mammograms, and a screening focus of 65% or greater. Estimated mean adjusted performance is presented graphically, along with pointwise 95% CIs, with the curves being interpreted directly as the mean adjusted performance as a function of the volume measure. P values for the estimated curves correspond to omnibus tests of whether there is any association between mean adjusted performance and volume.

