
Figure 2.
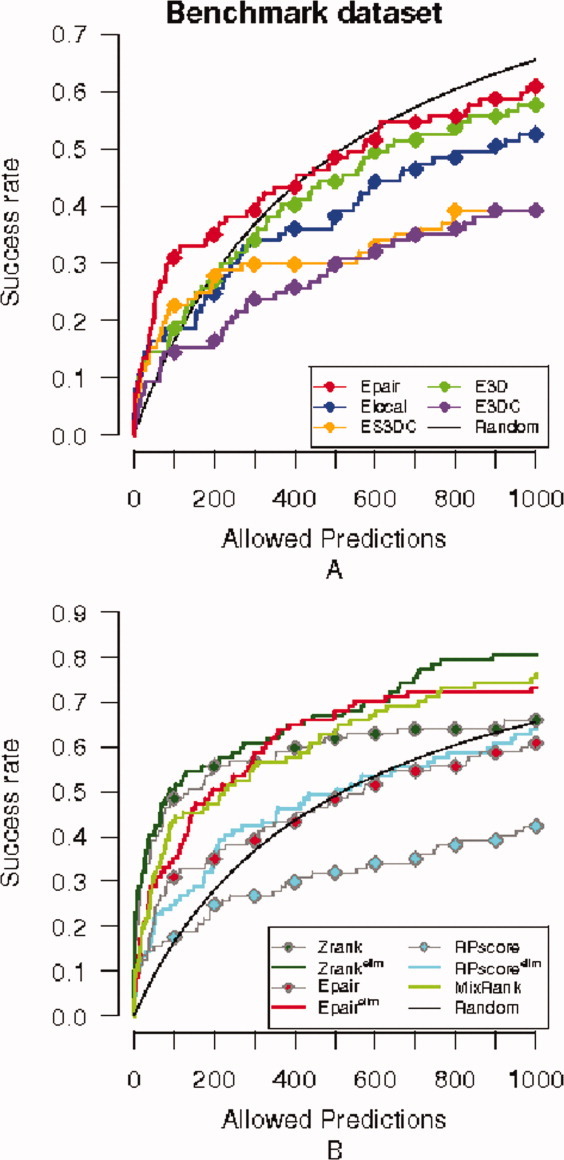
Success curves for the benchmark dataset. Success curves for the near-native criterion I-RMSD<2.5 Å are plotted. (A) Success curves for the five statistical potentials: Epair (red), ES3DC (orange), Elocal (blue), E3D (green), and E3DC (purple), plus the success curve expected by random (black). (B) Success curve of the MixRank strategy ranking and ranks with Epair, Zrank, RPScore scoring functions before and after application of the redundancy filter (superindex “elim” indicates the application of the filter).