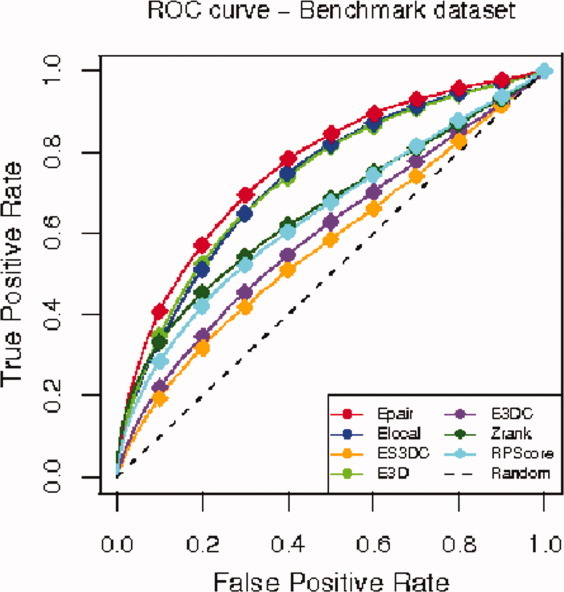
Figure 3.

ROC curves for the benchmark dataset. We plot the ROC curves for each of the five statistical potentials Epair (red), ES3DC (orange), Elocal (blue), E3D (light green), E3DC (purple), the scoring functions Zrank (dark green) and RPScore (light blue), and the random classification ROC curve (dashed black).
