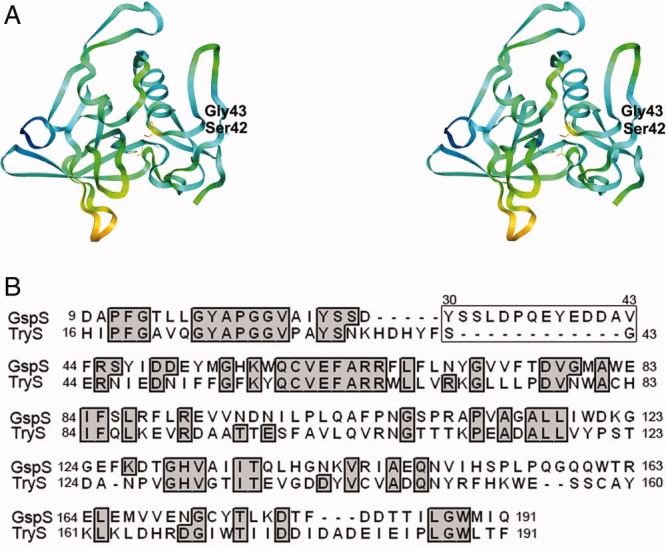
Figure 4.

(A) Stereo view of the L. major TryS N-terminal amidase domain. Different colors represent different B factors. (B) Structural alignment of E. coli GspS amidase and L. major TryS amidase. The box indicates the flexible helix-loop region around residues 30–43. This part is missing in the TryS structure.
