
Figure 6.
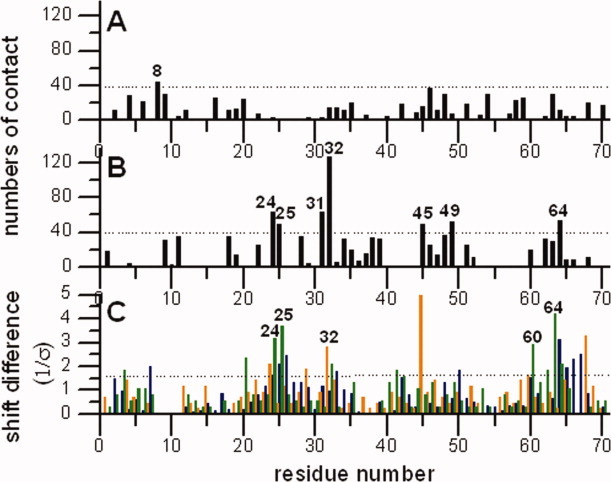
Plots of the numbers of intermolecular contacts (numbers of intermolecular C, N, and O atoms pairs, which have distance shorter than 5Å) with residues numbers in the 1UBQ (A) and the new ubiquitin structure (B) the numbers of intermolecular contacts were calculated by a home-written program, ACCEPT-NMR (described elsewhere). (C) The Cα (orange), CO (green), and N (blue) chemical shift differences between solid state assignments by Igumenova et al. and solution assignments by Wand et al. The shift differences were fitted by a Gaussian function and plotted the shift differences relative to the standard derivation of the mean σ. The shift differences falling outside the confidence interval of 89% on the best fitting Gaussian curve (dashed line, 1.6 σ) are considered to be outliers. Most of the residues having larger Cα, CO, and N perturbed shifts (label the residues have greater perturbed shifts at least two backbone chemical shifts are perturbed) also have higher numbers of intermolecular contacts in our new ubiquitin structure, but not in the 1UBQ structure.