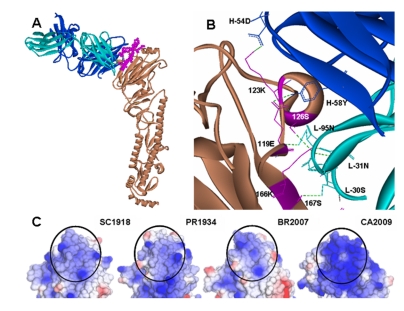
Figure 1.
(A) Antibody 2D1 docked in the CA2009 HA monomer. 2D1 light and heavy chains in cyan and blue respectively recognizes ‘Sa’ site indicated in pink. (B) Interacting residues in 2D1-CA2009 HA complex, with H-bonds shown in green dashes (C) Comparison of the electrostatic surface charge distribution in the ‘Sa’ region (circled) of the HAs of SC1918, PR1934, BR2007 and CA2009 viruses. Blue, white and red colors indicate basic, neutral, and acidic charge distribution respectively.

