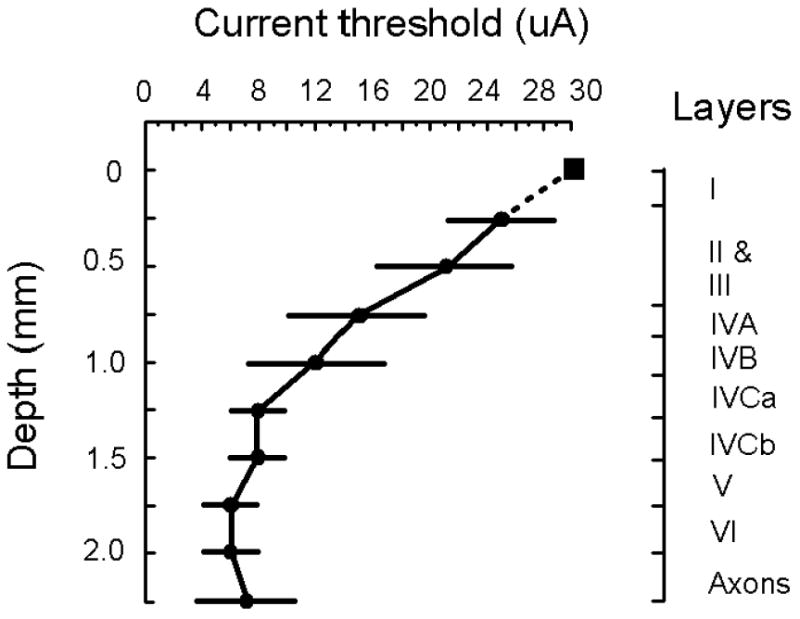
Figure 3.

Current threshold. The current threshold to evoke a detection response on 50% of stimulation trials is plotted as a function of cortical depth. Each value is based on an average taken from 11 penetrations made into V1 (9 penetrations from monkey C and 2 penetrations from monkey H). A total of 110 sites were studied, ten for each penetration. The probability of evoking a detection response for a given site with a particular current was based on 10 stimulation trials (see Fig. 2A for details). The square marker indicates that a detection response was not readily elicited from the site using a maximal current of 30 μA. Standard deviations are shown. Illustrated to the right is the lamination of macaque V1 over a 2.25 mm depth starting from top of superficial V1 (Peters and Sethares, 1991). Pulse duration, pulse frequency, and train duration were fixated at 0.2 ms, 200 Hz, and 100 ms, respectively. Cathode-first pulses were used for all experiments. All stimulation occurred 200 ms before the termination of the fixation spot. The detection rate for non-stimulation control trials was at 10% or less. All data were collected while a monkey performed the task illustrated in Figure 1C. Data are from monkeys C and H.
