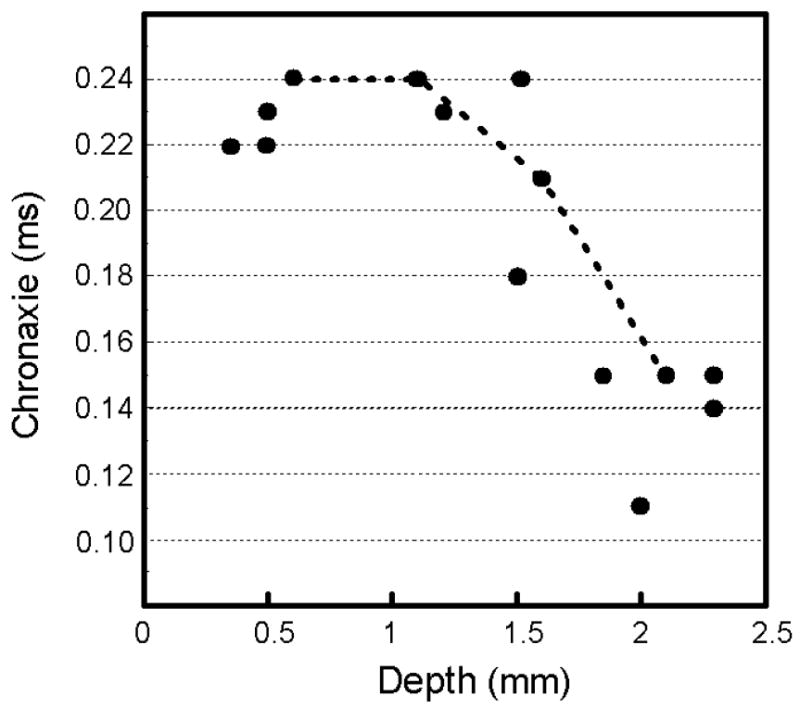
Figure 5.

Chronaxies over cortical depth. The chronaxie values of Figure 4 are plotted as a function of cortical depth. The dotted line links chronaxie values collected from the same penetration made into V1. Overall the chronaxie values drop as a function of cortical depth (r = -0.76, p < 0.01, n = 14).
