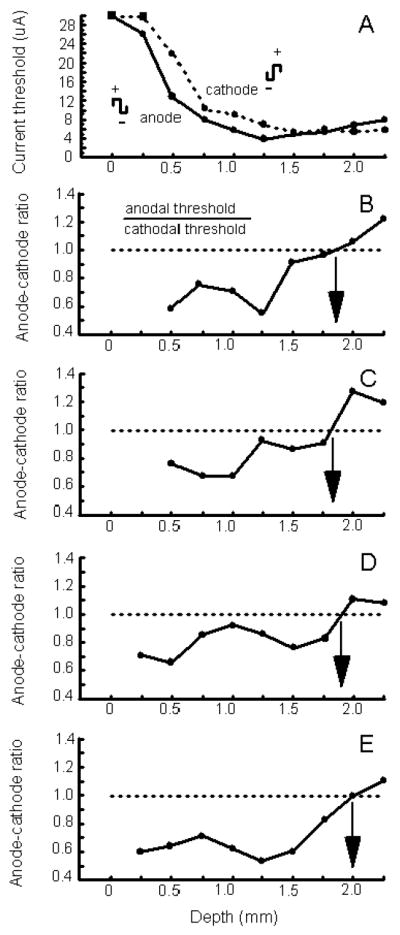
Figure 6.

Effects of anode-first versus cathode-first stimulation. (A) The current threshold to evoke a detection response on 50% of stimulation trials is plotted as a function of cortical depth for anode-first (solid curve) versus cathode-first (dotted curve) pulses for one penetration made into V1. Each data point for a curve is based on 10 stimulation trials. The square marks indicate that a detection response could not be evoked using a maximal current of 30 μA. Pulse duration, pulse frequency, and train duration were fixated at 0.2 ms, 200 Hz, and 100 ms, respectively. The detection rate for non-stimulation control trials was at 10% or less. All data were collected while a monkey performed the task illustrated in Figure 1C. See Figure 2A for other details. (B-E) Anode-cathode ratios are plotted as a function of cortical depth for three penetration sites made into V1. A ratio is determined by dividing the current threshold to evoke a detection response on 50% of stimulation trials using anode-first pulses by the current threshold to evoke a detection response on such trials using cathode-first pulses (see inset in B). The curve in B is based on data of ‘A’. For each curve (B-E), ratios were computed for sites between 0 and 2.5 mm below the surface of V1. Ratio values were not computed for the most superficial sites test (e.g. at a depth of 0 mm) since a detection response could not be evoked at these sites using a 30 μA current. The arrow within a panel indicates the depth at which the ratio equaled one. This is the depth beyond which cathode-first pulse became more effective than anode-first pulses. ‘A to D’ are from monkey C and ‘E’ is from monkey H.
