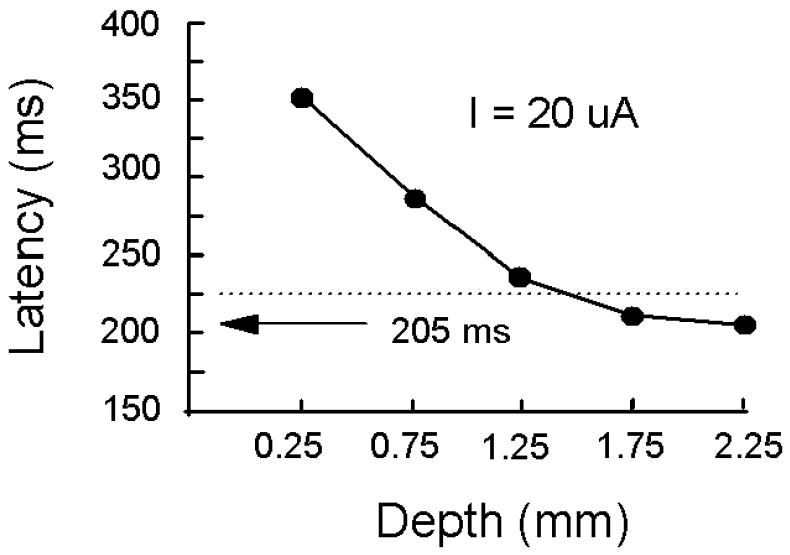
Figure 8.

Latency over cortical depth. The latency to evoke a detection response is plotted as a function of the depth below the cortical surface using a 20 μA current. These data were derived from Figure 7 by interpolating between the data points to yield the latency values. The arrow indicates a minimal latency of 205 ms at the greatest cortical depth tested. The dotted curve indicates the average latency to detect the visual target (standard error = 3 ms; N = 5 blocks of 10 trials each). See Figure 7 for details.
