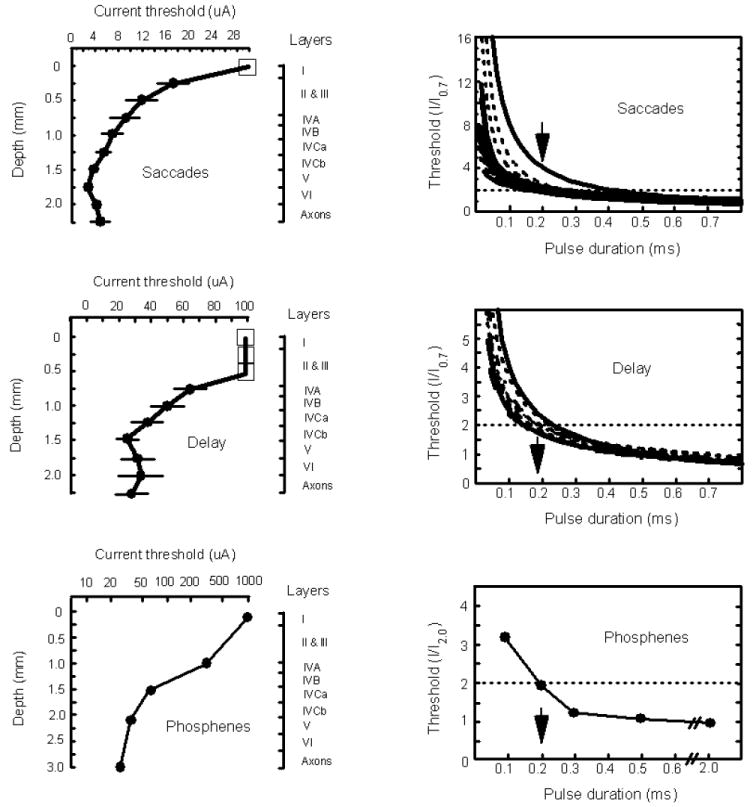
Figure 9.

Current threshold and chronaxie functions for saccades, saccadic delays, and phoshenes induced from V1. Left panels illustrate current threshold functions: (top, left) The current threshold to evoke a saccadic eye movements on 50% of stimulation trials is plotted as a function of cortical depth for macaque V1. The square marker indicates that saccades were not elicited using a maximal current of 30 μA. Standard errors of the mean are shown. Illustrated to the right is the lamination of V1 over a 2.25 mm depth starting from the top of V1 (Peters and Sethares, 1991). Pulse duration, pulse frequency, and train duration were fixated at 0.2 ms, 200 Hz, and 100 ms, respectively. Cathode-first pulses were used for all experiments. For other details see Tehovnik et al. (2003a). (middle, left) The current threshold to evoke a 20 ms saccadic delay of visually guided saccades made into the visual receptive field of the stimulated neuronal elements is plotted as a function of cortical depth for macaque V1. The square marker indicates that a delay was not elicited using a maximal current of 100 μA. Standard errors of the mean are shown. Illustrated to the right is the lamination of V1 over a 2.25 mm depth starting from top of V1 (Peters and Sethares, 1991). Pulse duration, pulse frequency, and train duration were fixated at 0.2 ms, 200 Hz, and 100 ms, respectively. Anode-first pulses were used for all experiments. For other details see Tehovnik et al. (2004). (bottom, left) The current threshold to evoke a phosphene from human V1 is plotted as a function of cortical depth for one penetration. The current is represented on a log scale. Illustrated to the right is the approximate lamination of human V1 (Rockel et al., 1980). Pulse duration, pulse frequency, and train duration were fixated at 0.2 ms, 100 Hz, and 1000 ms, respectively. Anode-first pulses were used for all experiments. For other details see Bak et al. (1990). Right panels illustrate chronaxie functions: (top, right) Normalized threshold current for evoking a saccadic eye movement on 50% of stimulation trials is plotted as a function of pulse duration for macaque V1. For a pulse duration of 0.7 ms, the current required to evoke a saccade on 50% of stimulation trials is set to one and all other values are expressed as a multiple of the current used at the 0.7-ms pulse duration. The pulse duration at which a curve intersects two units of threshold (designated by the dotted horizontal line) indicates the chronaxie of the stimulated elements at the site of study. The arrow indicates an average chronaxie of 0.2 ms. Pulse frequency and train duration were fixated at 100 Hz and 100 ms, respectively. Cathode-first pulses were used for all experiments. For other details see Tehovnik et al. (2003a). (middle, right) Normalized threshold current for evoking a 20 ms delay of visually guided saccades made into the visual receptive field of the stimulated neuronal elements is plotted as a function of pulse duration for macaque V1. For a pulse duration of 0.7 ms, the current required to evoke a 20 ms delay is set to one and all other values are expressed as a multiple of the current used at the 0.7-ms pulse duration. The pulse duration at which a curve intersects two units of threshold (designated by the dotted horizontal line) indicates the chronaxie of the stimulated elements at the site of study. The arrow indicates an average chronaxie of 0.18 ms. Pulse frequency and train duration were fixated at 100 Hz and 100 ms, respectively. Anode-first pulses were used for all experiments. For other details see Tehovnik et al. (2004). (bottom, right) Normalized threshold current for evoking a phosphene is plotted as a function of pulse duration based on the average of five site studied over the surface of human V1. For a pulse duration of 2 ms, the current required to evoke a phosphene is set to one and all other values are expressed as a multiple of the current used at the 2-ms pulse duration. The pulse duration at which a curve intersects two units of threshold (designated by the dotted horizontal line) indicates the chronaxie of the stimulated elements. The arrow indicates a chronaxie of 0.2 ms. Pulse frequency and train duration was fixated at 100 Hz and 100 ms, respectively. Cathodal pulses were used for all experiments. For other details see Rushton & Brindley (1978).
