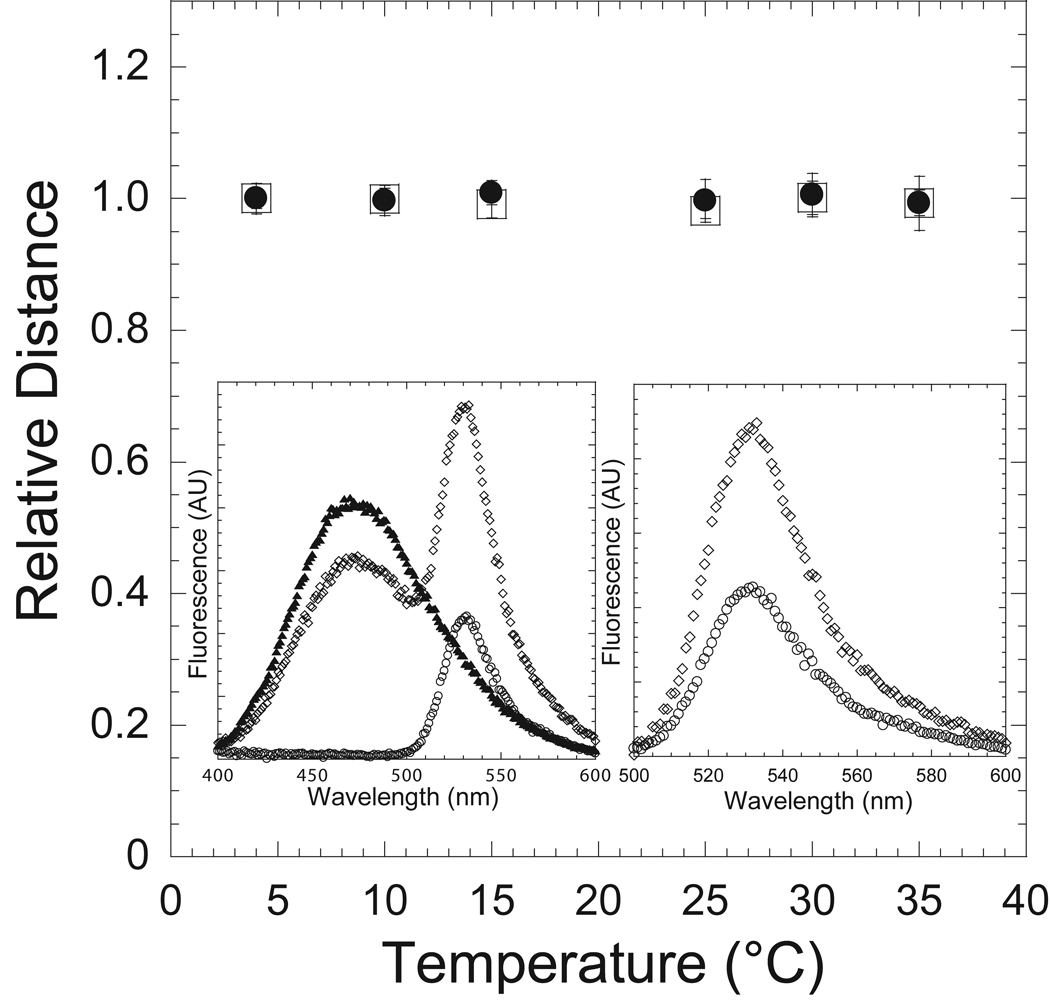
Figure 3. Conformation of the actin-binding cleft as a function of temperature in the ADP and APO actomyosin states.
MV FlAsH complexed with IAEDANS-actin in the presence (circles) and absence (squares) of ADP was examined as a function of temperature as in Figure 2. The FRET was monitored by acceptor enhancement and the calculated distance is shown as a function of temperature (relative to the distance at 4 °C). Error bars represent the standard deviation from at least three separate experiments done with three different protein preparations.

