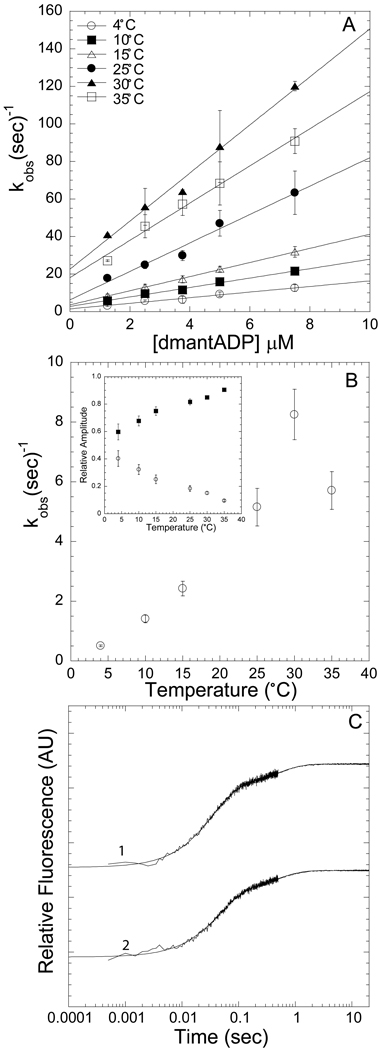
Figure 4. Kinetics of dmantADP binding to actomyosin V FlAsH.
We observed a fast and a slow phase with all association reactions measured. A) The fast phase, which was dependent on ligand concentration and temperature, was fit to a linear relationship to obtain the second-order binding constant at each temperature (symbols for 4, 10, 15, 25, 30, 35 °C are in order top to bottom). B) The slow phase was independent of ligand concentration but was temperature dependent. Inset demonstrates the relative amplitudes of the fast (closed squares) and slow (open diamonds) phases at each temperature. C) Representative fluorescence transients are shown on a log scale, 0.25 µM actomyosin V FlAsH and 7.5 µM dmantADP or 2.5 µM dmantADP at 15 °C [biexponential fits: 21.8 ± 0.2 and 2.1 ± 0.1 sec−1 (χ2 = 0.73, R2 = 0.99); 28.7 ± 0.3 and 2.0 ± 0.1 sec−1 (χ2 = 0.96, R2 = 0.99)]. Error bars in A and B represent the standard error from three separate protein preparations.

