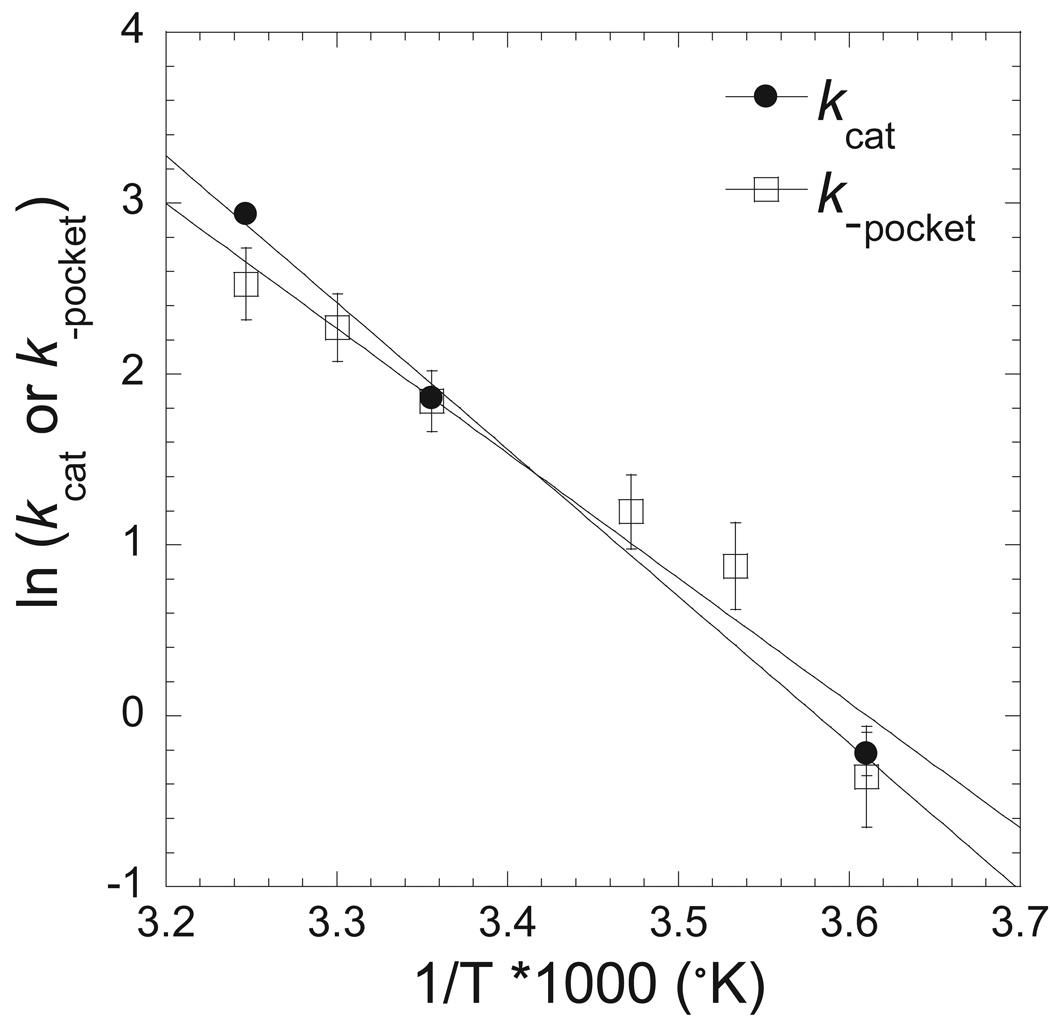
Figure 7. Correlation of maximal ATPase and pocket conformational change rates as a function of temperature.
The rate constant for pocket opening and maximal ATPase rate are shown as a function of temperature in an Eyring plot. The data is fit to a linear relationship with a similar slope for kcat (slope) and k−pocket (slope) providing evidence that the pocket opening step is rate limiting in myosin V.

