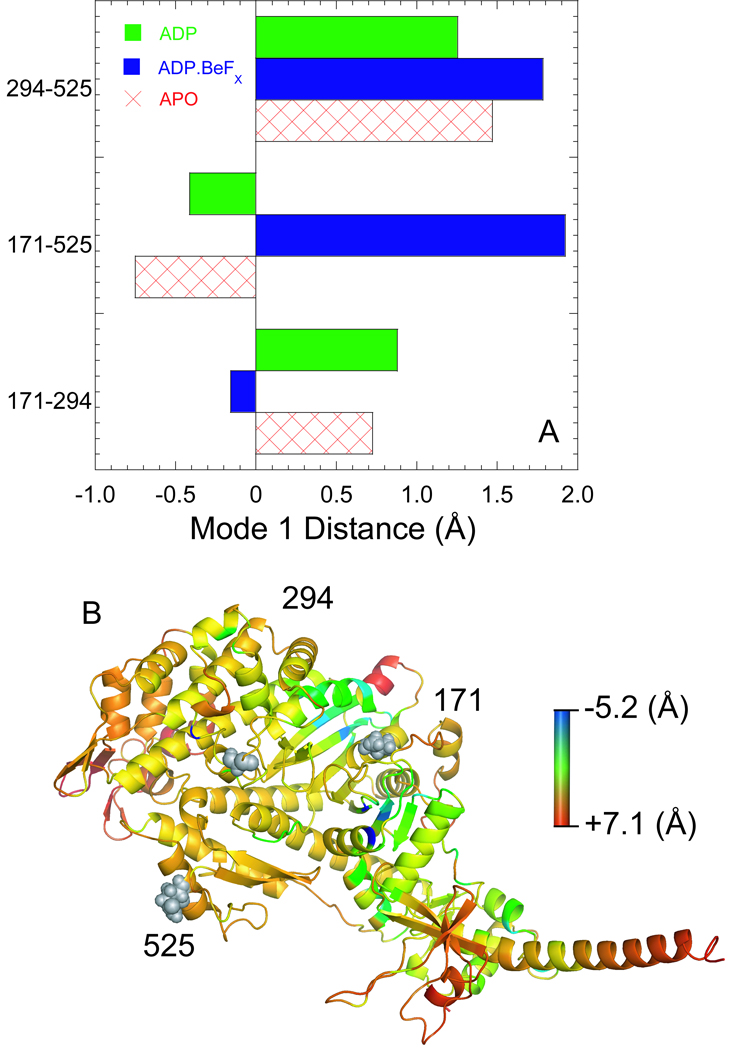
Figure 8. Intrinsic flexibility and dynamiccs of the MV crystal structures.
A) We performed PCA analysis using FRODA to examine the relative motions of three residue pairs (294-171, 171–525, and 294–525) in all three crystal structures. The correlated motions were similar in the MV.ADP and MV.APO states although different in magnitude, while they were quite different in magnitude and direction in the MV.ADP.BeFX state. B) The residue root mean square deviation (RMSD) determined by FRODA was examined in the MV.APO and MV.ADP crystal structures. The MV.APO residue RMSD was subtracted from the MV.ADP residue RMSD and the relative flexibility change is shown in a ribbon diagram The color scale is shown with red representing the most positive change in RMSD (MV.ADP more flexible than MV.APO) and blue representing the most negative change in RMSD (MV.APO more flexible than MV.ADP).

