Figure 6.
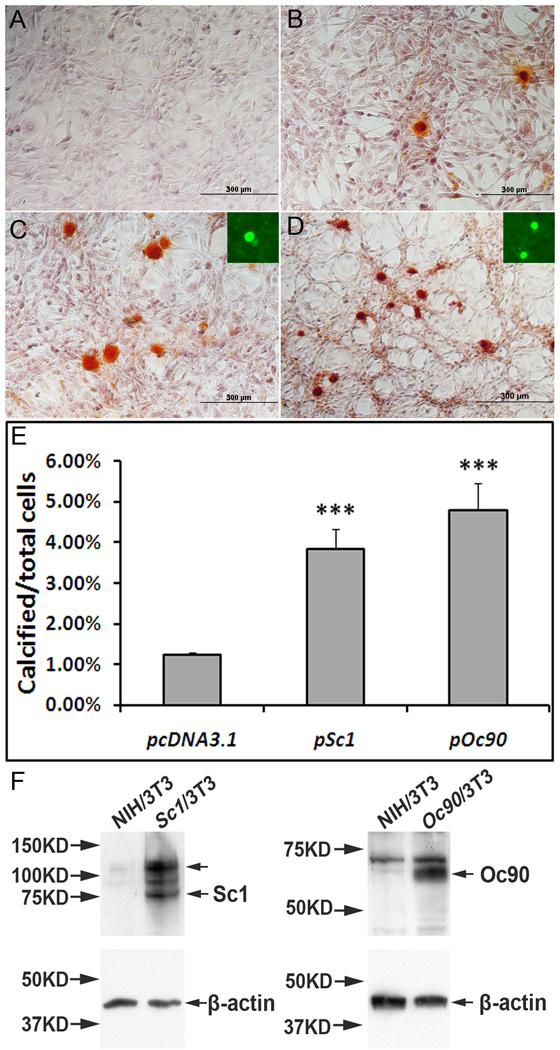
The effects of Oc90 or Sc1 on ECM calcification. NIH/3T3 cells stably transfected with (C) pSc1 and (D) pOc90 calcified intensely after 5 days of induction with 0.5 mM Ca2+ and 2mM Pi. Inorganic calcium deposits were visualized with ARS staining, proteins with fluorescent immunostaining. Averaged percentages of cells with ECM calcification over total cells were compared for different vectors. Under the same culture conditions, untransfected cells and cells transfected with empty vectors (pcDNA3.1 is shown in B) had similar ratios of calcification, but both had significantly lower ratios than those transfected with Oc90 or Sc1 (Figure 6C & 6D vs. 6B, p<0.001, n=3 experiments × 3~4 survey fields in each). Insets in C & D show that Sc1 and Oc90, respectively, are present in the calcified nodules. Figure 6E shows histograms of the averaged percentages of cells with ECM calcification. No calcification was seen in cells transfected with any of these constructs and cultured under standard media without supplemental Ca2+ and Pi (A). (E) Western blotting of Sc1 and Oc90 in untransfected and transfected cells. 20 µg total protein was loaded in each lane. Each membrane was stripped and re-used for β-actin detection. The upper arrow in the Sc1 lane corresponds to Sc1 dimer in the size of ~130–140 kD.

