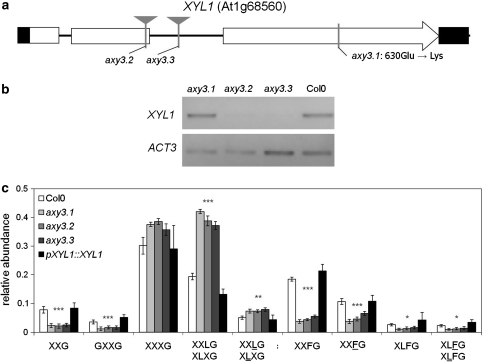
Fig. 2.
Analysis of XYL1 expression in axy3 mutant lines. a XYL1 gene model. XYL1 contains three exons, depicted as white rectangles; non-coding regions are shown as a black line. Black rectangles depict the UTRs. The location of T-DNA insertional lines are indicated by gray triangles, the location of the EMS induced mutation is indicated by a gray vertical line. Location of single nucleotide polymorphism and the resulting amino acid changes between Sha and Bay0 are shown as dotted lines. The EMS induced mutation leads to an amino acid change from glutamic acid (GAG) to lysine (AAG) in amino acid 630. b Semi-quantitative RT-PCR showing expression levels of XYL1 in axy3 mutants indicating. c OLIMP analysis of XyG of etiolated seedlings from Col0, axy3.1, axy3.2, axy3.3 and a complementation line expressing XYL1 driven by its native promoter (pXYL1::XYL1) in axy3.1. The mean relative abundance (n = 6, ±SD) of XyG oligos is shown. Asterisks indicate consistent significant changes of all three mutant lines compared to wild type and complementation line (* p = 0.05, ** p = 0.01, *** p = 0.001) by Student’s t test

