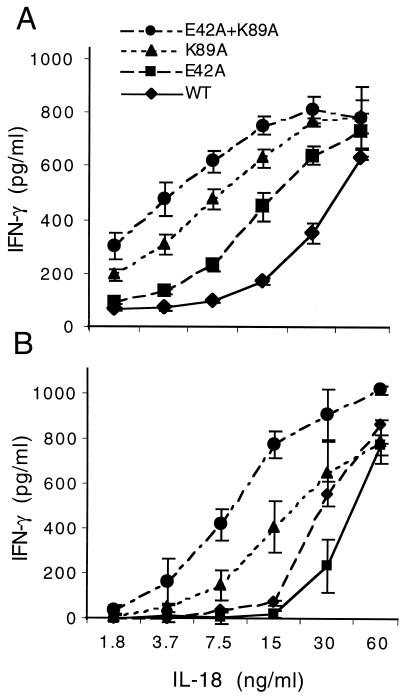
Figure 3.
Biological activity of different human IL-18 analogues. (A) NKO cells were stimulated with each of the different IL-18 analogues at concentrations shown under the horizontal axis in the presence of IL-12 (0.5 ng/ml). (B) PBMCs were stimulated with each of the different IL-18 analogues at concentrations shown under the horizontal axis in the presence of IL-12 (1.0 ng/ml). After 24 h, IFN-γ was measured; it is shown on the vertical axis in pg/ml (mean ± SEM). n = 3.

