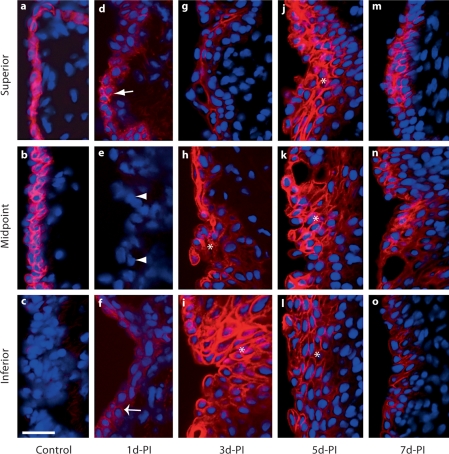
Fig. 7.
High-magnification representative images (corresponding to the small red boxes in fig. 6) illustrating changes in TGase-1 immunoactivity in the rat vocal fold epithelium following injury. d Arrow indicates superior-region TGase-1+ epithelial cells at 1 day postinjury. e Arrowheads indicate midpoint-region TGase-1– epithelial cells at 1 day postinjury. f The wide arrow indicates inferior-region TGase-1+ epithelial cells at 1 day postinjury. h–l Asterisks indicate TGase-1+ epithelial cell clusters at 3–5 days postinjury. d-PI = Days postinjury. Scale bar = 20 μm.

