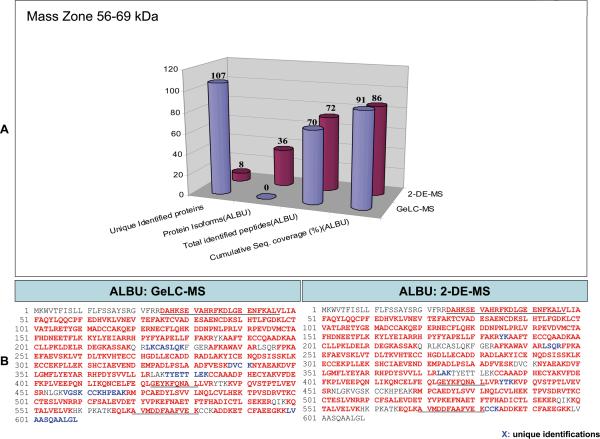
Figure 2. Comparison of the identification results from GeLC-MS and 2DE.
A) Graphical representation of the results from the analysis of the 56-69kDa band zone by GeLC-MS and 2DE referring to the number of unique protein identifications provided by each technique; using albumin as an example, a comparison of the number of detected isoforms, peptides, and respective cumulative sequence coverage (%) provided by each technique is also made. B) The sequences of the identified peptides using GeLC-MS and 2DE are also shown. Red characters indicate the identified peptides of the protein and blue characters indicate unique identifications by one approach. For comparison, regions of the protein detected as native peptides by CE-MS and/or LC-MS are underlined.

