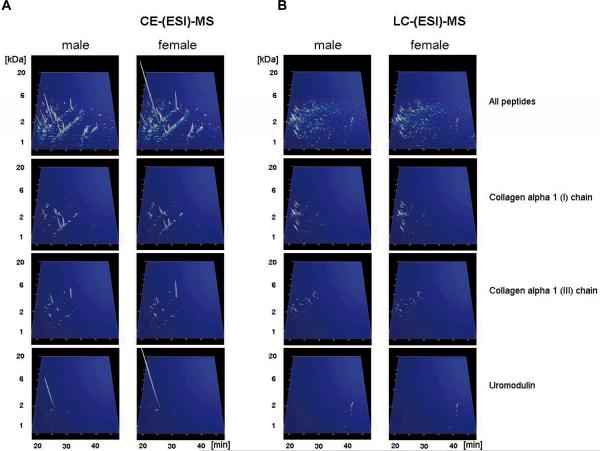
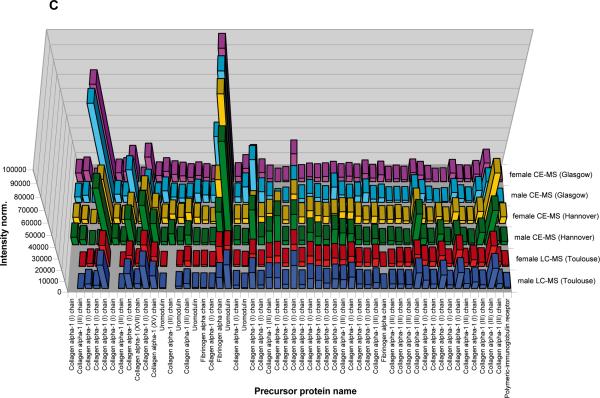
Figure 3. Display of the low molecular weight proteome of the human urine standard.
A) Peptides and proteins detected using CE-MS: shown are compiled patterns of the individual analyses. The molecular mass on a logarithmic scale (0.8 – 20 kDa, indicated on the left) is plotted against normalized migration time (18–48 min, indicated on the bottom). Average signal intensity is encoded by peak height and color. Upper panel: all detected signals (corresponding to Supplementary `Detailed Tables', spreadsheet: `CE-(ESI)-MS male, female'). Lower panels: Distribution of the collagen alpha 1 (I), the collagen alpha 1 (III), and the uromodulin peptides, as indicated on the left. B) Peptides and proteins detected using LC-MS. Shown are compiled patterns of the individual analyses. The molecular mass on a logarithmic scale (0.8 – 20 kDa, indicated on the left) is plotted against retention time (18–48 min, indicated on the bottom). Average signal intensity is encoded by peak height and color. Upper panel: all detected signals (corresponding to Supplementary `Detailed Tables', spreadsheet: `LC-(ESI)-MS female, male'). Lower panels: Distribution of the collagen alpha 1 (I), the collagen alpha 1 (III), and the uromodulin peptides, as indicated on the right. C) Inter-laboratory and inter-platform comparisons of the 40 most abundant sequenced peptides (based on ion counting) in the standard male and the female samples. These peptides account for ~40% of the total signal. The majority of these peptides represent degradation products from collagen, uromodulin, and fibrinogen, as indicated on the bottom. As expected, a very high similarity between the data obtained on the two samples on an identical instrument can be observed, with most of these peptides being among the 40 most abundant peptides in both samples. When comparing data obtained on similar, yet different instruments (comparing upper two panels from CE-TOF with the middle 2 panels from CE-Q-TOF), good comparability can be observed, and most peptides can be detected with similar abundance. Analysis of the same samples on a completely different platform (LC-coupled Orbitrap) results in similar data. Most noticeable: the absence of very small and very large peptides in the LC-MS analysis. This is likely due to small and highly charged peptides not binding to the reversed-phase material, while large peptides likely precipitating on the column, and thereby not eluting.


