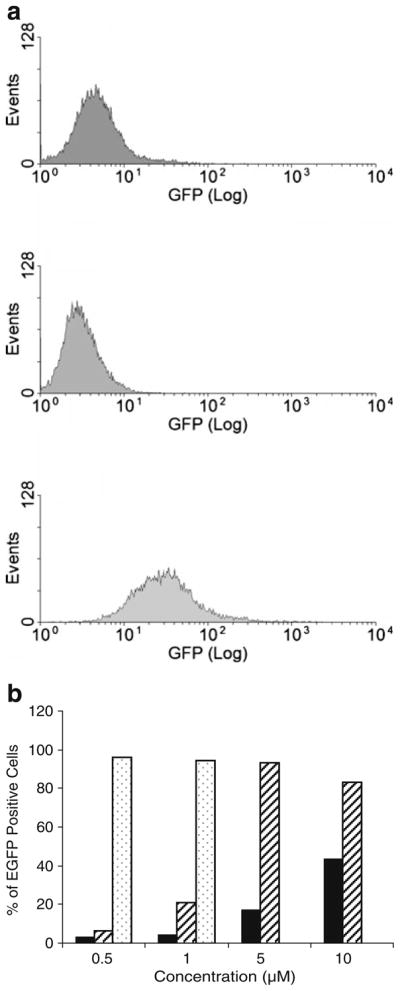
Fig. 2.

FACS analysis showing the cellular uptake of PKAS into βTC-3 cells. a Distribution of fluorescent intensity in cells exposed to (i) buffer, (ii) EGFP-lacking TAT, and (iii) PKAS. b Concentration and time dependent translocation of PKAS. Incubation times were (filled bar) 1 h, (striped bar) 3 h, and (dotted bar) 6 h
