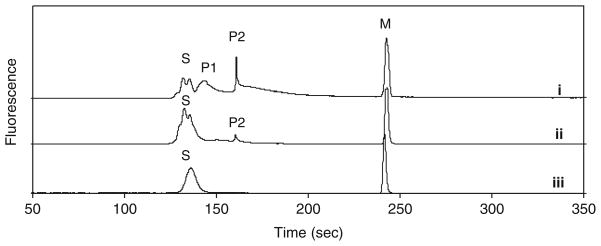
Fig. 5.
PKA catalyzed phosphorylation of PKAS in βTC-3 cells. Cells were loaded with PKAS and incubated in 3 mM glucose for 3 h. Cell lysate was analyzed by CZE (i) before and (ii) after addition of alkaline phosphatase. (iii) PKAS was added to a control βTC-3 cell lysate prepared in the absence of PKAS. Peak S is the substrate, peaks P1 and P2 are the phosphorylated products and peak M is a carboxyfluorescein internal standard. Separation conditions: 25 μm i. d. capillary, 20 mM borate, pH=9.3, 400 V/cm

