
Fig 6.
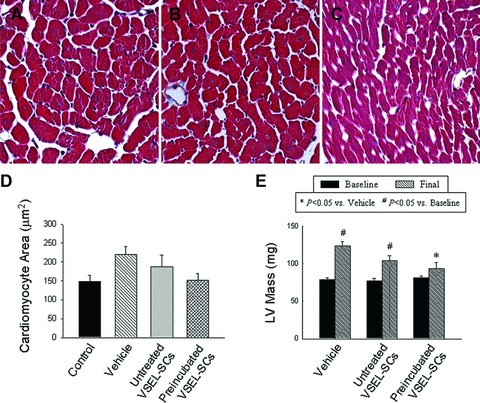
Impact of cell therapy on cardiomyocyte hypertrophy and LV mass. (A)–(C) Representative images of cardiomyocytes in the viable myocardium from Masson’s trichrome-stained sections of hearts of mice that were given vehicle (group I) (A), expanded and untreated VSEL-SCs (group II) (B) and expanded pre-incubated VSEL-SCs (group III) (C). (D) Quantitative assessment of myocyte cross-sectional area in groups I–III compared with non-infarcted control hearts. (E) Compared with group I, echocardiographically estimated LV mass was significantly less in group III. Data are means ± S.E.M. n= 7–11 mice/group. (E) *P<0.05 versus vehicle (final); #P < 0.05 versus respective baseline values.