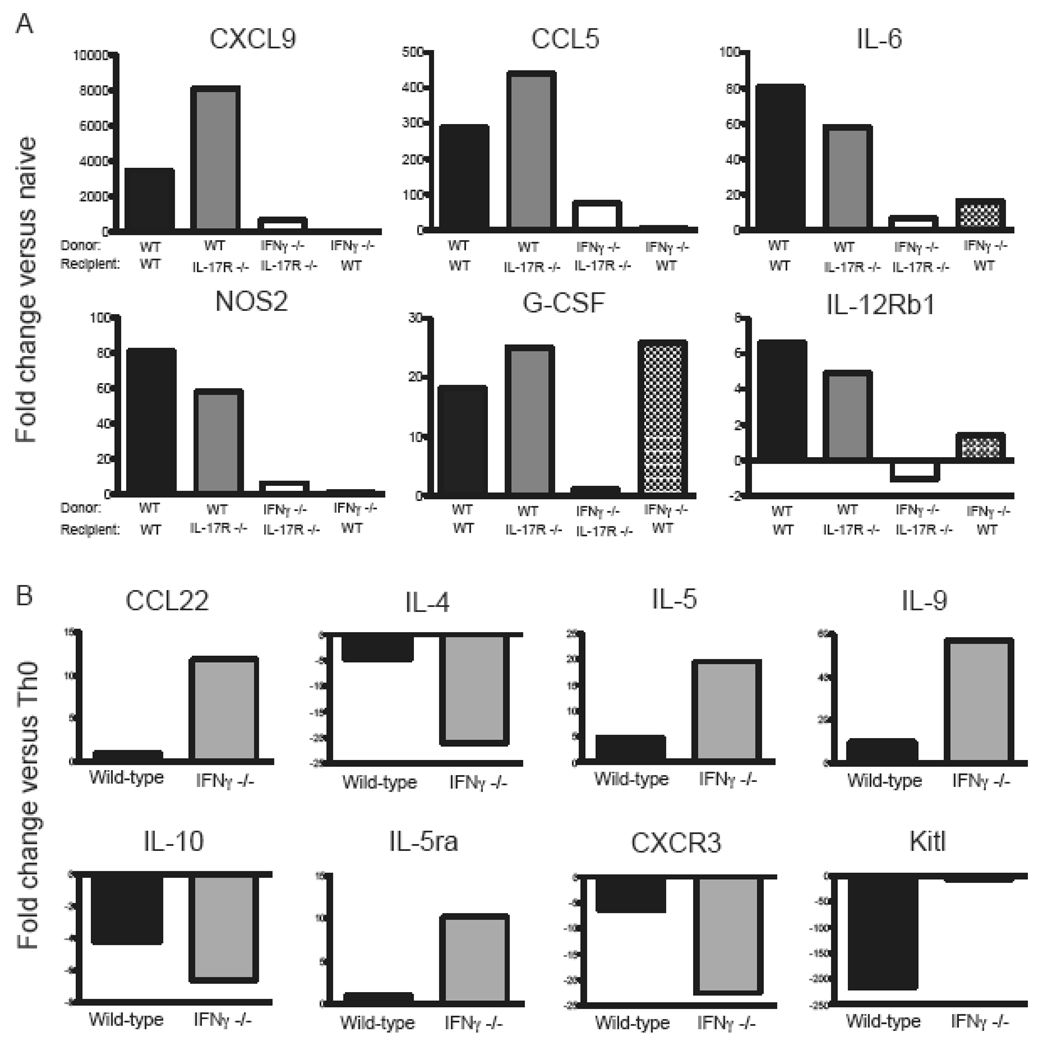
Figure 4. Gene expression in donor CD4+ T cells and peak EAE.
(A) RNA was isolated from spinal cords of mice at peak EAE (n=3/ group). qPCR was performed to measure expression of a panel of proinflammatory molecules. Transcript levels were normalized to the geometric mean of GAPDH, βactin, and HPRT. Data are shown as fold change over naïve spinal cords. (B) RNA was isolated from WT of IFNγ−/− MOG-specific CD4+ T cells after polarization under Th17 or Th0 polarizing conditions. qPCR was performed, and data was normalized to the geometric mean of GAPDH, βactin, and HPRT. Data is shown as the ratio of normalized mRNA expression in Th17 over Th0 CD4+ T cells.

