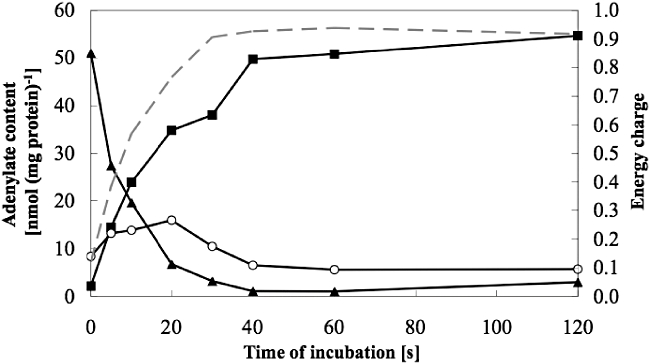
Fig. 1.

Transformation of adenylate nucleotides and adenylate energy charge (AEC) in washed, pigmented cell suspensions (see Supporting information S2 for more detail) of Dinoroseobacter shibae (OD436 = 10). To measure the AEC, a modified luciferin-luciferase assay was used which allows a precise quantification of ATP, ADP and AMP in a single assay (see Supporting information S5 for more detail). Cells were pre-incubated under anoxic conditions in the dark for 2 h. Upon addition of oxygen, fast ATP ( ) formation occurred. The AMP (▴) concentration decreased correspondingly, while ADP (○) increased only transiently. This results in an increase of the energy charge (dashed line). All values are averages from two independent measurements.
