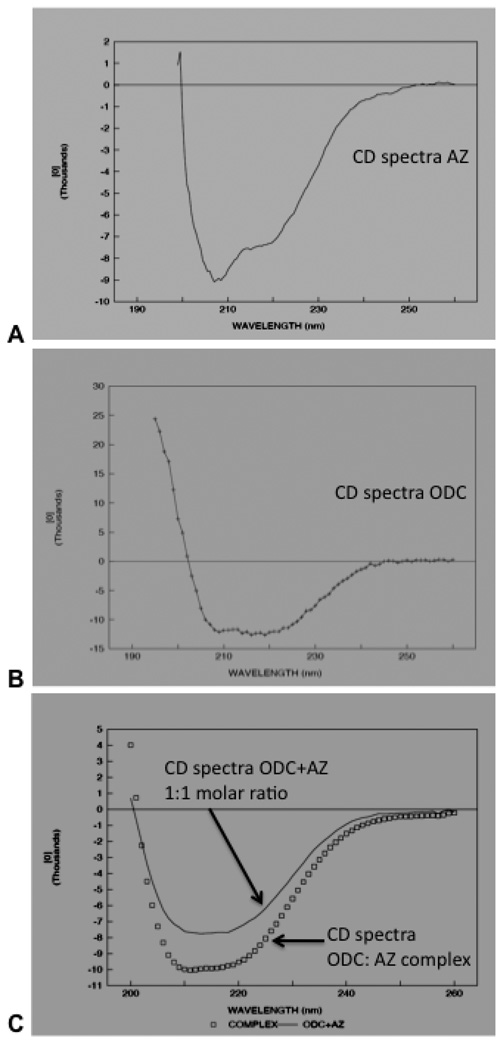
Fig. 4. CD spectra of purified AZ, ODC and ODC: AZ complex show a change in secondary structure in the complex.
Far UV (260–190 nm) CD spectra of purified antizyme (A) and ornithine decarboxylase (B) proteins. Antizyme or ornithine decarboxylase proteins at 0.1 mg/ml were run on a CD (JASCO) and the mean ellipticity of the molecule was determined. The data was analyzed to calculate the percentage of α-helices and β-sheets present in antizyme protein as mentioned in the text. (C). Far UV (260–190 nm) CD spectra of purified ODC: AZ complex (0.1 mg/ml) is shown here. The data were calculated and compared with the sum of the CD spectra of 1:1 molar ratios two molecules.

