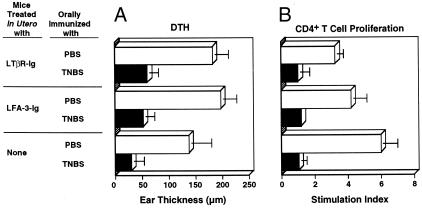
Figure 4.
The effects of oral administration of TNBS on DTH (A) and T-cell-proliferative (B) responses 7 and 14 days after TNCB sensitization. The details of the assays are described in Materials and Methods. The stimulation index was determined as described in the legend of Fig. 2. The level of thymidine incorporation for each control well was between 500 and 1,000 cpm. The results represent the mean values ± SEM from three separate experiments (triplicate wells/experiment).

