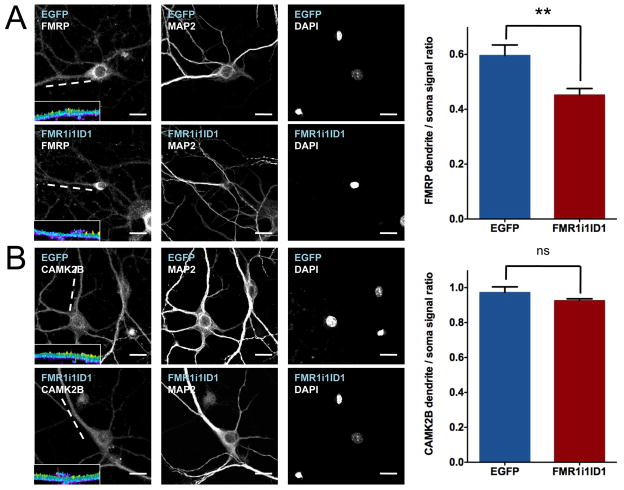
Figure 4.
Intronic ID element sequences modify subcellular distributions of endogenous proteins. Immunofluorescence with antibodies to FMRP (A) and CAMK2B (B) on primary hippocampal neurons transfected with pEGFP-N1 and FMR1i1ID1-EGFP constructs. Blue text indicates transfected DNA construct, white text indicates antibody target. Graphs at right represent immuno signal as ratios of dendrite to soma with SEM indicated. Mean dendritic to somal signal ratio +/− SEM for FMRP immunostaining: EGFP 0.56 +/− 0.04 (n=10), FMR1i1ID1 0.45 +/− 0.02 (n=13), t-test p = 0.0031. Mean dendritic to somal signal ratio +/− SEM for CAMK2B immunostaining: EGFP 0.97 +/− 0.03 (n=7), FMR1i1ID1 0.93 +/− 0.01 (n=9), t-test p = 0.16. Insets are three-dimensional topographical plots of signal intensity for the indicated dendrites (white lines) on a 0 (dark blue) to 2000 (yellow) pseudocolor range, showing a decreased signal for FMRP along the length of the FMR1i1ID1-transfected dendrite compared to the EGFP-transfected dendrite; no such difference is observed for CAMK2B. Scale bars = 20μm.

