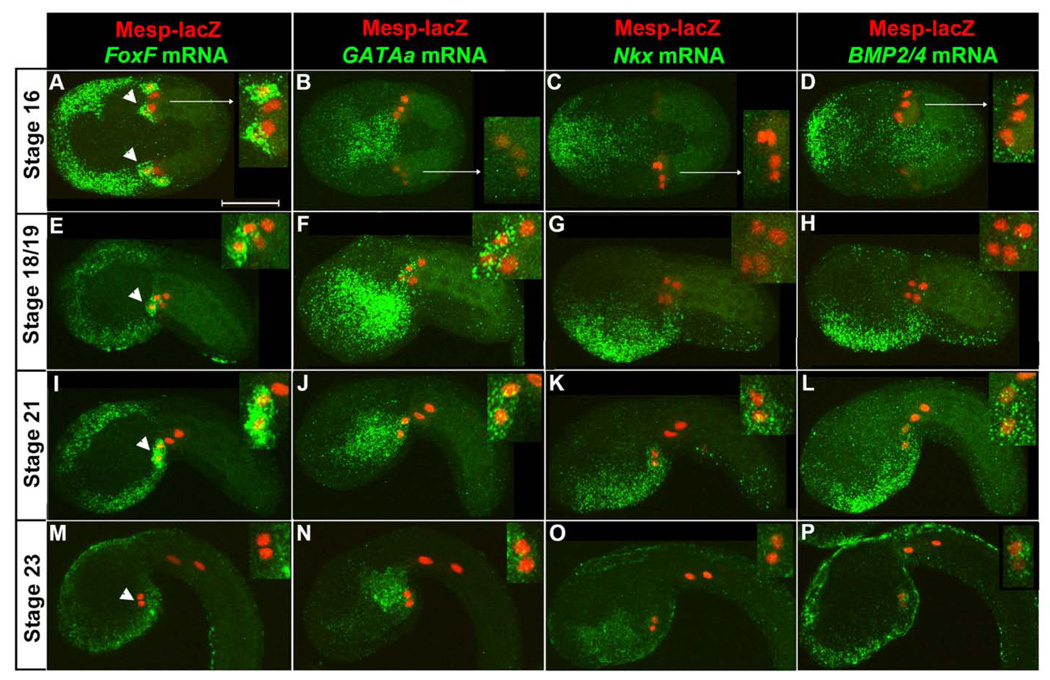
Figure 1. Temporal analysis of GATAa expression relative to other heart progenitor genes.
Representative expression patterns from stage 16 to stage 23 as indicated (visualized transcripts denoted above each column in green, stages to the left, n=20–30 embryos for each condition). All embryos shown anterior to the left in this and all subsequent figures. Embryos in (A–D) were imaged from the ventral side while embryos in (E–P) were imaged laterally, dorsal side up. Nuclei of TVCs and ATMs are marked by β-gal antibody staining (red). Inset panels display magnified views of the B7.5 lineage. Note that the TVCs are the more anterior lineage, as marked by arrowheads in the first column. The weak β-gal staining on one side of the embryos in (C, D) represents mosaic incorporation of transgenic markers. Scale bar: 50 µm.

