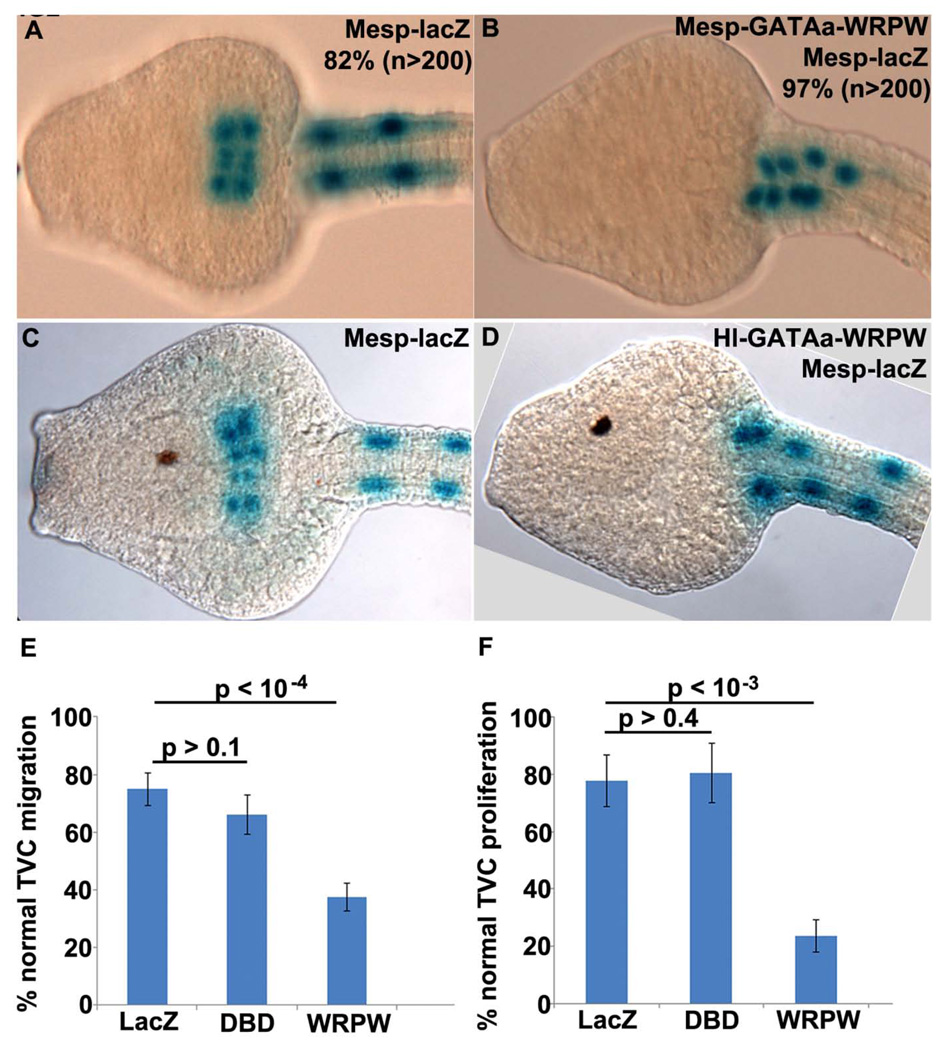
Figure 2. Disruption of GATAa activity in the TVCs affects their migration and proliferation.
(A–D) Representative ventral views of stage 24 embryos (13.5 hpf) expressing Mesp-lacZ alone (A, C) or co-electroporated with Mesp-GATAa-WRWP (B) or Hl-GATAa-WRPW (D). Occurrence of highly consistent phenotypes are included numerically in panels (A,B) while more variable phenotypes observed in (C,D) are represented graphically in the following panels. (E, F) Plots showing percentage of stage 24 embryos with normal TVC migration (E) and proliferation (F). In both graphs, LacZ = Hl-lacZ / Mesp-lacZ embryos, DBD = Hl-GATAa-DBD / Mesp-lacZ embryos, WRPW = Hl-GATAa-WRPW / Mesp-lacZ embryos. (E) LacZ (n=813), DBD (n=478), WRPW (n=804). (F) LacZ (n=314), DBD (n=361), WRPW (n=543). In this and subsequent graphs each sample includes at least two independent trials, p values were calculated with a two sample t-test assuming unequal variances and error bars correspond to Standard Error of the Mean (SEM).

