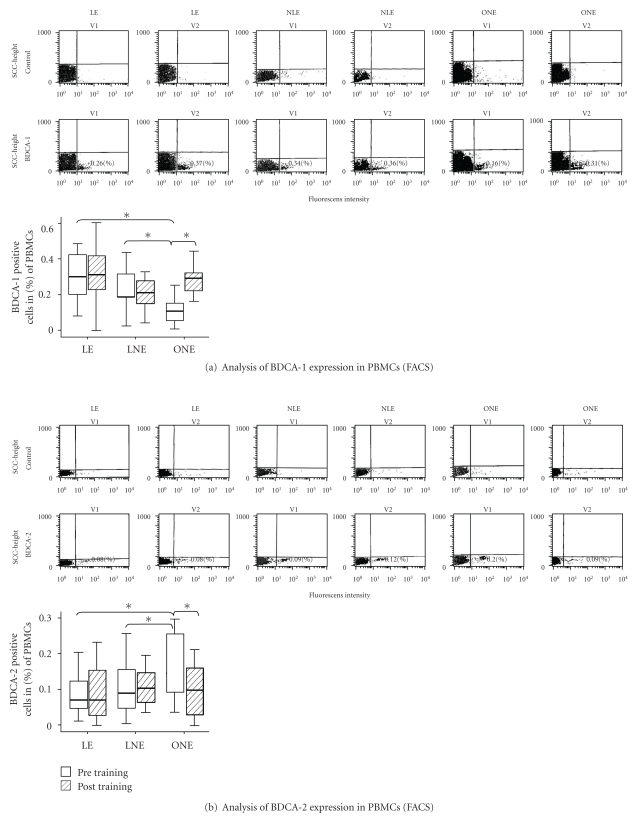
Figure 1.
Representative FACS scans in PBMC expressing of BDCA-1 (a) and BDCA-2 (b) in LE, LNE, and ONE at baseline and after training. Data presented state the expression of the corresponding receptors in percent. Statistical analysis of the different timepoints (intra group analysis) was performed using the Wilcoxon Test; the comparison of the different groups with each other (inter group analysis) was done by using the Mann-Whitney U Test (*P < .05; n = 15/16/16).

