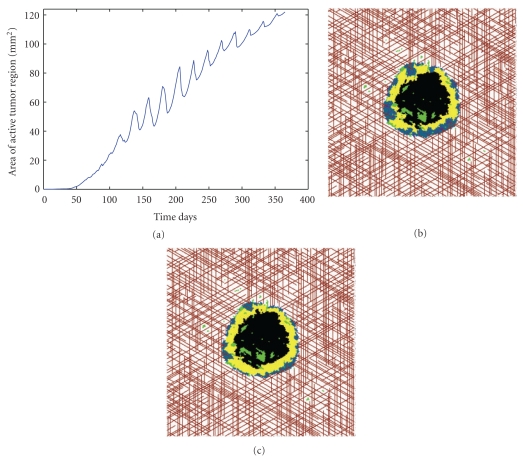
Figure 7.
(a) Active area of a single tumor with T 3 = 0.6. (b) Snapshot of tumor the day before VDA is administered. Notice the purple angiogenic vessels penetrating the tumor surface. (c) Snapshot of tumor the day after VDA is administered. Notice the absence of purple angiogenic vessels penetrating the tumor although red coopted vessels still supply the tumor with oxygen and nutrients.

